Zone Redundancy Is Best-Effort Lab
Test the operator assumption that zoneRedundant=true plus minReplicas=N guarantees N replicas land in N Availability Zones. Statistically falsify or confirm the platform's behavior using parallel multi-min deployments and a deterministic perturbation control.
Lab Metadata
| Field | Value |
|---|---|
| Difficulty | Advanced |
| Duration | 8-26 hours (24 h primary baseline + perturbation runs) |
| Tier | Workload profiles (Consumption profile inside a zone-redundant environment) |
| Category | Reliability / Platform behavior |
| Failure Mode | Clustered multi-replica churn within a 60-second window for a single app |
| Skills Practiced | Pre-registered hypothesis testing, KQL analysis, perturbation control, Bicep, retry-budget measurement |
flowchart TD
    A[Zone-redundant Container Apps env] --> B[app-min2 min=max=2]
    A --> C[app-min3 min=max=3]
    A --> D[app-min6 min=max=6]
    E[Audit Job cron 5m] --> F[ARM REST list replicas]
    F --> G[ContainerAppConsoleLogs_CL<br/>ReplicaInventorySample JSON]
    B --> H[ContainerAppSystemLogs_CL<br/>ContainerTerminated / Started]
    C --> H
    D --> H
    I[trigger.sh --perturb restart] --> J[az containerapp revision restart]
    J --> H
    K[trigger.sh --load --client no-retry/retry-backoff] --> L[Local stdout JSON<br/>LoadEnd success/fail totals<br/>not ingested into LAW]
    G --> M[KQL pack Q1-Q4, Q6, Q7<br/>H0a falsification]
    H --> M
    L --> N[Local analysis<br/>H0b client-visible failure rate]
1. Question
Does a zone-redundant Container Apps environment, configured with minReplicas == maxReplicas == N and explicit resource requests, produce clustered multi-replica churn events for the same app over a 24-hour baseline window without operator action — and when those events occur, do they correlate with client-visible 503 failures?
The question is framed as two pre-registered hypotheses (Section 3) so the lab is falsifiable from observation alone, not from interpretation.
2. Setup
Region selection
Pick a region that supports both Container Apps workload profiles and Availability Zones. Verified options: koreacentral, eastus, westeurope, japaneast. Cross-check the current matrix in Reliability in Azure Container Apps before deploying.
Required environment variables
export RG="rg-aca-zr-lab"
export LOCATION="koreacentral"
export SUBSCRIPTION_ID="<subscription-id>"

az account set --subscription "$SUBSCRIPTION_ID"
az extension add --name containerapp --upgrade
| Command | Purpose |
|---|---|
az account set --subscription "$SUBSCRIPTION_ID" | Switches the CLI context to the subscription that owns the lab resources so every subsequent environment, revision, and metrics command runs against the intended zone-redundancy scenario. |
az extension add --name containerapp --upgrade | Ensures the Container Apps CLI extension is installed and current before you run the environment and revision commands used by this zone-redundancy lab. |
Deploy the lab
| Command | Why it is used |
|---|---|
./deploy.sh | Wraps az group create + az deployment group create against infra/main.bicep. Provisions VNet /16 + delegated /23 subnet, Log Analytics (90-day retention), UAMI with RG-scoped Reader role, zone-redundant Container Apps environment with a workload profile, three identical subject apps with minReplicas==maxReplicas==2/3/6, and an audit Job firing every 5 minutes. |
./verify.sh | Confirms properties.zoneRedundant==true on the environment, each subject app reports Running with the expected minReplicas, the audit Job is provisioned, and a Log Analytics workspace exists in the RG. The script does not validate the cron schedule on the audit Job or the Log Analytics wiring on the env — confirm those manually via Section 12's CLI evidence commands or the Portal. |
Build the audit image
The default auditImage parameter is a placeholder (mcr.microsoft.com/azure-cli:2.83.0) that emits a single notice JSON so deployment succeeds before the custom image is built. To produce real ReplicaInventorySample samples:
ACR="<your-acr>.azurecr.io"
az acr build --registry "$(basename "$ACR" .azurecr.io)" \
    --image "zr-lab/audit:latest" \
    ./audit

az deployment group create \
    --resource-group "$RG" \
    --template-file ./infra/main.bicep \
    --parameters ./infra/main.parameters.json \
    --parameters auditImage="${ACR}/zr-lab/audit:latest" \
    --parameters auditAcrName="$(basename "$ACR" .azurecr.io)"
| Command | Why it is used |
|---|---|
az acr build ... | Builds the audit container (Mariner + bash + curl + jq) from the audit/ directory and pushes to your ACR in one cloud-side step. |
az deployment group create ... auditImage=... auditAcrName=... | Re-deploys the Bicep template with the real audit image. auditAcrName is required so the Bicep grants the Job's UAMI AcrPull on the registry and emits a registries block; without it the first image pull fails with 401 Unauthorized. The ACR must live in the same resource group as the lab (the Bicep looks it up as an existing resource in resourceGroup()). Idempotent so the env and apps are not recreated. |
3. Hypothesis
Two pre-registered null hypotheses. Both are stated before running any perturbation; the experiment is structured to keep these definitions immutable for the duration of the run.
H0a — Platform does not produce clustered multi-replica churn
In a zone-redundant Container Apps environment with fixed
minReplicas=N(Nin{2,3,6}) and explicit resource requests, the platform does not produce clustered multi-replica churn for the same app within any 60-second window over a 24-hour baseline period without operator action.
Clustered churn is defined operationally as:
Two or more replicas of the same app are observed in
ContainerTerminatedstate within a single 60-second bin inContainerAppSystemLogs_CL.
H0b — Clustered churn does not correlate with client-visible 503 spikes
When clustered multi-replica churn occurs (regardless of cause), the rate of HTTP
503responses observed at the ingress for that app does not spike above the baseline rate during the 60-second window covering the churn event, when the calling client uses defaultno-retrybehavior.
| Variable | Control State | Experimental State |
|---|---|---|
zoneRedundant on env | true | true |
| Resource requests | Explicit (0.5 vCPU, 1 Gi) | Explicit (0.5 vCPU, 1 Gi) |
minReplicas == maxReplicas per app | 2, 3, 6 | 2, 3, 6 |
| Probes | Startup + Readiness + Liveness | Same |
| Operator action | None (24-h baseline) | trigger.sh --perturb restart |
| Client retry | no-retry (baseline H0b) | retry-backoff (L2 measurement) |
Pre-registered analysis plan
To prevent post-hoc reframing once data is in hand, the lab commits to these decisions before the first measurement:
- Primary metric for H0a: count of clustered-churn events per app over the 24-h baseline window from KQL Q3. A non-zero count for any app falsifies H0a.
- Primary metric for H0b: client-visible failure rate from the single
trigger.sh --combined --client no-retry --duration 180run, using theLoadEndtotals (fail / total) for the perturbation window that contains the Q3-confirmed clustered-churn event. Anyfail >= 1during that window falsifies H0b for this lab run. The lab does not query KQL for the 5xx signal — the helloworld sample app does not emit structured access logs, andtrigger.shoutput is not ingested into Log Analytics. See "Limitations" in Section 12. - Secondary metrics (descriptive only, not used to confirm/refute):
-
Stopping rule: collect a single 24-h baseline window, then execute exactly three perturbation events against
app-min3in sequence, recording the exact UTC timestamp of each event into the committed evidence corpus:- One supplemental
restart-allrun —trigger.sh --perturb restartwith no client load. Deterministicaz containerapp revision restartagainst the active revision; characterizes worst-caseMaxReplacementFractionwithout load confounding. - One combined
no-retryrun of 180 s —trigger.sh --combined --client no-retry --duration 180. Load harness fires fromLoadStartthroughLoadEnd; revision-restart fires mid-window. This is the H0b primary metric (Section 3, item 2). - One combined
retry-backoffrun of 180 s —trigger.sh --combined --client retry-backoff --duration 180. Quantifies the L2 mitigation effect.
Do not extend the run on the basis of early results. This stopping rule supersedes any earlier "exactly three perturbation runs per client variant" framing; the lab's pre-registered design intentionally trades multi-run replication for tight scope and committed evidence corpus, per the design rationale in issue #204. 5. What this lab does NOT measure: (a) per-replica AZ placement — the Azure Container Apps management plane does not expose it, and IMDS inside a Container Apps replica is unsupported; any zone-related conclusion is
[Inferred]from clustered-churn patterns, never[Observed]per-replica zone data. (b) Server-side 5xx counts joined to Q3 windows in KQL — the lab's sample app does not produce ingested HTTP access logs; production users with App Insights or ingress logs can satisfy this via the optional Q5 template. - One supplemental
4. Prediction
If the platform delivers the strict "N replicas in N zones, zero clustered churn" interpretation many operators assume, then:
- H0a is not falsified — Q3 returns zero rows during the 24-h baseline.
- H0b is not falsified — during the single
trigger.sh --combined --client no-retry --duration 180run onapp-min3,LoadEnd.fail == 0. - The
no-retryandretry-backoffclient variants converge to identical success rates.
If the platform delivers best-effort distribution (the published MS Learn behavior), then:
- H0a may be falsified — Q3 returns at least one row, most likely on
app-min2andapp-min3rather thanapp-min6. - H0b is likely falsified for the
no-retryclient during perturbation;retry-backoffmeasurably narrows the gap. MaxReplacementFractionis highest (closest to1.0) onapp-min2, where every clustered churn is more likely to take out the whole app.
5. Experiment
Phase 1 — Baseline (24 hours, no operator action)
./verify.sh
date -u +"%Y-%m-%dT%H:%M:%SZ" > /tmp/zr-baseline-start.txt

# Wait 24 hours. Do not touch the apps, env, or audit Job.
# Optional: tail the audit output via az containerapp job execution list.

date -u +"%Y-%m-%dT%H:%M:%SZ" > /tmp/zr-baseline-end.txt
| Command | Why it is used |
|---|---|
./verify.sh | Health-check wrapper that confirms the resource group, env zoneRedundant=true flag, each subject app's runningStatus == Running + minReplicas == N + replica count, the audit Job's provisioningState == Succeeded, and the presence of a Log Analytics workspace. It does not query the workspace for ReplicaInventorySample ingestion — that signal only appears after the 5-minute audit cron has fired at least once, and is verified separately by KQL Q1 in Section 7. Wait at least one audit tick after deploy before running Q1. |
date -u +"..." > /tmp/zr-baseline-start.txt / end.txt | Bookend timestamps for the baseline window. Quoted into the Observed Evidence subsection of Section 12 and used as the manual BaselineWindow filter for KQL Q3/Q6. |
az containerapp job execution list --resource-group "$RG" --name "audit-sampler" --query "[].{name:name, status:properties.status}" --output table | Optional spot-check during the baseline window to confirm the audit cron is still firing every 5 min without restarting the host shell or running additional perturbation. |
Phase 2 — Perturbation (controlled — three runs total against app-min3)
Per the stopping rule pre-registered in Section 3 item 4, the perturbation phase consists of exactly three runs against app-min3, executed in sequence with their exact UTC timestamps recorded in the committed evidence corpus. There is no inner loop and no multi-run replication: the H0b primary metric is the single combined no-retry run, and the retry-backoff run quantifies the L2 mitigation effect. The supplemental restart-all run characterizes worst-case MaxReplacementFraction without load confounding.
Always pipe stdout to a durable file under labs/zone-redundancy-best-effort/evidence/ (not /tmp/, which Phase 2 of the original partial run lost). Each filename embeds the variant tag and a UTC timestamp so KQL Q6 can isolate the windows.
EV=labs/zone-redundancy-best-effort/evidence
TS() { date -u +"%Y%m%d%H%M%S"; }

# Run 1 (supplemental) — restart-only, no load. Worst-case MaxReplacementFraction.
./trigger.sh --perturb restart --app app-min3 \
    | tee "$EV/perturbation-variant-a-restart-only-$(TS).log"
sleep 1800   # Record the actual gap before Run 2 in the evidence filename/timestamp; no minimum gap is asserted by this reproduction.

# Run 2 (H0b primary) — combined no-retry, 180 s. Single restart fires mid-window.
./trigger.sh --combined --client no-retry --duration 180 --app app-min3 \
    | tee "$EV/perturbation-variant-b-restart-load-$(TS).log"
sleep 1800   # Record the actual gap before Run 3 in the evidence filename/timestamp; no minimum gap is asserted by this reproduction.

# Run 3 (L2 mitigation measurement) — combined retry-backoff, 180 s.
./trigger.sh --combined --client retry-backoff --duration 180 --app app-min3 \
    | tee "$EV/perturbation-variant-c-retry-backoff-$(TS).log"
| Command | Why it is used |
|---|---|
./trigger.sh --perturb restart --app app-min3 | Runs az containerapp revision restart against the active revision of app-min3 with no client load. This is the supplemental restart-all variant from #204; it characterizes worst-case MaxReplacementFraction without confounding from concurrent load. Emits no LoadEnd event. |
./trigger.sh --combined --client no-retry --duration 180 --app app-min3 | Runs the load harness for 180 seconds at --rps 10, fires az containerapp revision restart 25% of the way through, and emits PerturbationStart / LoadEnd JSON to stdout. This is the H0b primary metric run — the single LoadEnd.fail / LoadEnd.total total is the falsification signal per Section 3 item 2. |
./trigger.sh --combined --client retry-backoff --duration 180 --app app-min3 | Same as the no-retry combined run but with retry-backoff (up to 4 retries with 0.2s, 0.4s, 0.8s, 1.6s backoff). Quantifies the L2 mitigation effect — [Strongly Suggested], not [Measured], because it is a single run rather than a paired baseline / perturbation comparison. |
--client no-retry | Issues exactly one curl per request; every 503 surfaces as a client-visible failure. Required by the H0b primary metric. |
--client retry-backoff | Used by Run 3 only. |
Phase 3 — (Optional) Cross-app comparison
Repeat one full perturbation pair against app-min2 and app-min6 to populate Q7 with three subject apps.
6. Execution
Run Phase 1 continuously for 24 hours with no other lab activity in $RG. For Phase 2, run the three perturbation events in sequence; each event is timestamped and analyzed as a distinct perturbation window in the committed evidence corpus. Capture every command's stdout into labs/zone-redundancy-best-effort/evidence/ (per the Phase 2 runbook in Section 5 — not /tmp/, which the lab's original partial run lost) so Q6's PerturbWindows datatable can be hand-populated from the committed PerturbationStart timestamps after the fact.
7. Observation
After Phase 1 + 2 + (optional) 3, run the KQL pack queries in order:
| Query | What you record |
|---|---|
| Q1 | HealthRatio of audit-Job ingestion. Anything < 0.5 invalidates the downstream baseline. |
| Q2 | Per-app SteadyStateOK over the 24-h baseline. |
| Q3 | Every clustered-churn event (baseline and perturbation). |
| Q4 | RecoverySecs for each event. |
| Q5 | Optional — only meaningful if you wire App Insights to the subject apps; the default sample app does not emit ingested 5xx telemetry. The lab's H0b verdict uses trigger.sh stdout totals instead. |
| Q6 | Baseline vs perturbation ChurnPerHour per app. |
| Q7 | ClusteredChurnEvents and MaxReplacementFraction per minReplicas. |
Record the exact numbers in the Observed Evidence subsection of Section 12.
8. Measurement
The lab's primary metrics, derived directly from the pre-registered KQL queries and from trigger.sh local stdout:
[Measured]BaselineChurnEventsper app over 24 h (from Q3, filtered to the baseline window from Q6).[Measured]PerturbationChurnEventsper app and client variant (from Q3 + Q6).[Measured]MaxReplacementFractionperminReplicas(from Q7).[Measured]RecoverySecsp50 / p95 across all events (from Q4).[Measured]Client-visible failure rate per variant, computed locally fromtrigger.sh --client {no-retry,retry-backoff}stdout (LoadEnd.fail / LoadEnd.total). This is the H0b primary metric — see Section 3.[Inferred]H0b verdict tying client-visible failure rate during a perturbation window to a Q3-confirmed clustered-churn event. The inference is necessary becausetrigger.shstdout is not joined to Q3 in KQL.
9. Analysis
Combine the measurements with the pre-registered analysis plan:
- H0a evaluation: If
BaselineChurnEvents == 0for all three apps, H0a is not falsified for this 24-h window. If any app hasBaselineChurnEvents >= 1, H0a is falsified — record the timestamps and replica IDs as[Observed]evidence. - H0b evaluation: From the single
trigger.sh --combined --client no-retry --duration 180run, take theLoadEnd.fail / LoadEnd.totaltotals for the perturbation window that contains the Q3-confirmed clustered-churn event. Iffail >= 1, H0b is falsified. This is a[Measured]failure rate but only an[Inferred]causal link to the churn event, becausetrigger.shstdout and Q3 are joined manually by timestamp, not in KQL. - Client variant comparison: Compute the failure-rate ratio between
no-retryandretry-backoffruns against the same app. A ratio>> 1(no-retry fails much more) is[Measured]evidence that L2 client-side resilience is the dominant mitigation for clustered churn. - Cross-app comparison: Examine whether
BaselineChurnEventsdecreases monotonically withminReplicas. A monotonic decrease is[Correlated]evidence that higherminReplicasdilutes churn impact. A flat or increasing pattern is[Observed]evidence that raising replica count alone is not a sufficient mitigation.
10. Conclusion
State the conclusion in three buckets, one per evidence level, citing only the pre-registered measurements:
- Confirmed (or falsified) hypotheses: H0a and H0b verdict, with the specific Q3 numbers and
trigger.shLoadEndtotals that drove the decision. - Confirmed secondary effects: L2 retry impact, cross-app pattern.
- Open / not measurable: per-replica AZ placement (always
[Not Proven]for this lab regardless of result).
11. Falsification
The lab is built to be falsifiable in two complementary directions:
- Negative-control rigor: A baseline window with
BaselineChurnEvents == 0for all three apps falsifies the working hypothesis that the platform produces clustered churn. The lab reports zero baseline rows as[Observed]evidence that no clustered-churn event was detected in this 24-hour window, and[Inferred]evidence that any platform-driven churn is below this run's detection floor for this configuration. - Positive-control rigor:
trigger.sh --perturb restartis a deterministic restart of the active revision. Q3 must return a row covering the perturbation timestamp; if it does not, the audit pipeline or Q3 itself is broken and no downstream conclusion is valid. Re-run Phase 1 first.
12. Evidence
Required CLI evidence (always collected)
| Evidence | Command / Query | Purpose |
|---|---|---|
| Env zone-redundant flag | az containerapp env show --resource-group "$RG" --name "$ENV_NAME" --query properties.zoneRedundant | Confirms true; falsifies "zone-redundancy never claimed" defense |
| Per-app scale config | az containerapp show --resource-group "$RG" --name "$APP_NAME" --query properties.template.scale | Confirms minReplicas == maxReplicas per app |
| Resource shape | az containerapp show --resource-group "$RG" --name "$APP_NAME" --query "properties.template.containers[].resources" | Confirms explicit requests; eliminates the "underspecified scheduler input" confounder |
| Audit Job execution | az containerapp job execution list --resource-group "$RG" --name "audit-sampler" --query "[].{name:name, status:properties.status}" --output table | Confirms the audit cron fired during the window |
| Perturbation timestamps | Contents of labs/zone-redundancy-best-effort/evidence/perturbation-variant-*.log (PerturbationStart event in each JSONL file) | Source for Q6's PerturbWindows datatable |
Required KQL evidence
Run Mass-Reschedule KQL pack Q1-Q4, Q6, Q7. Q5 is optional — only meaningful if you wire App Insights (or another ingested 5xx source) to the subject apps; the default sample image does not emit ingested 5xx telemetry and the lab's H0b verdict comes from trigger.sh stdout (see Section 3, item 2).
Optional setup: Custom subject-app image + Azure Monitor workbook
This lab ships two opt-in components for richer evidence beyond the default helloworld image. The infrastructure for both components is committed under labs/zone-redundancy-best-effort/; measured evidence (AppRequests rows for Q5 + C9/C13 Portal captures) will be added in a follow-up reproduction run.
- Custom subject-app image at
labs/zone-redundancy-best-effort/apps/(Python Flask + Azure Monitor OpenTelemetry Distro). Override theappImageparameter onaz deployment group createto deploy — for a private ACR image, you must also passappAcrNameso the Bicep wires upAcrPulland theregistriesblock (otherwise the first image pull fails with401 Unauthorized); seeapps/README.mdfor the fullaz acr build+az deployment group createflow. PopulatesAppRequestswithAppRoleNameequal to the container app name (auto-injected by Container Apps viaCONTAINER_APP_NAME) and the/errorroute returns HTTP 500 for Q5 validation. Once running, KQL pack Q5 surfaces app-handled 5xx telemetry (validates telemetry plumbing and exposes the/errorroute exception path) and capture C9 becomes capturable. The H0b verdict continues to rely ontrigger.sh --client no-retrystdout totals (LoadEnd.fail / LoadEnd.total) — ingress-generated 503s during clustered churn never reach the Flask process and therefore produce noAppRequestsrow, so Q5 alone is not a KQL-backed H0b verdict. A true KQL-backed H0b would require ingesting ingress-side or client-side 5xx telemetry, which this lab defers to a follow-up. - Azure Monitor workbook at
labs/zone-redundancy-best-effort/workbook/(3-panel: Q3 clustered churn table, Q4 recovery duration line chart, Q7 multi-app comparison bar chart). Deploy from thelabs/zone-redundancy-best-effort/workbook/directory viaaz deployment group create --resource-group $RG --template-file workbook-arm.json --parameters workbookSourceId=$LAW_ID(where$LAW_IDis the lab Log Analytics workspace resource ID; seeworkbook/README.mdfor the full deploy flow). Once deployed, the workbook becomes visible in the workspace gallery and capture C13 becomes capturable.
The infra/main.bicep template now provisions a workspace-based Application Insights resource (appi-zrlab-${suffix}, linked to the existing law Log Analytics workspace) and injects APPLICATIONINSIGHTS_CONNECTION_STRING as a secret-backed environment variable on each of the three subject Container Apps. The default appImage remains mcr.microsoft.com/azuredocs/containerapps-helloworld:latest so existing reproductions continue to work unchanged; the connection string is harmlessly ignored by the helloworld image.
Observed Evidence (Live Azure Reproduction)
Run scope — full reproduction (reproduced)
This evidence comes from a complete reproduction in koreacentral: a true 24-hour Phase 1 baseline window (2026-06-12T11:51:46Z → 2026-06-13T11:51:46Z) followed by three Phase 2 perturbation variants against app-min3 (2026-06-14T11:04–11:31Z). All raw artifacts are committed under labs/zone-redundancy-best-effort/evidence/ (KQL outputs in both .json and .table.txt, perturbation logs in JSONL).
What this run proves:
- H0a is NOT falsified for this 24-h window in koreacentral. Q3 returned zero rows across all three apps (
app-min2,app-min3,app-min6) over the full 24-hour baseline; Q2 reportedSteadyStateOK=Truefor all 289 audit samples per app; Q1 reportedHealthRatio=1.0over 867 ingested samples. The lab did not observe clustered multi-replica churn during this baseline — Q3 returned zero rows for both the clustered (≥2) and any-termination variants over the full 24-h window. Read this as an absence-of-evidence result scoped to one measured 24-h window in one region, not a general guarantee that platform-driven clustered churn never occurs. - H0b is NOT falsified under the tested load profile (180-second windows, 10 RPS, single-revision restart). The
no-retryclient variant — which is the H0b primary metric per Section 3 — observed 0 / 990 failures during the perturbation window; theretry-backoffvariant observed 0 / 960 failures. Combined: 0 / 1950 client-visible failures across two restart events on aminReplicas=3app. As called out in the caveat below, this does not generalize to higher RPS, multi-revision events, or longer load windows. - MaxReplacementFraction=1.0 was
[Measured]onapp-min3(Q7). A singleaz containerapp revision restartagainst the active revision momentarily terminated all 3 replicas within one 60-second window before new replicas finished spinning up. This is the smoking-gun evidence that operator-initiated rolling restart does not preserveminReplicascontinuity at the replica level — ingress drained the requests cleanly enough that 0 client-visible failures still occurred, but the temporal clustering is real and observable inContainerAppSystemLogs_CL. - Claim 2 ("zone redundancy distributes replicas evenly across zones") remains capped at
[Strongly Suggested]and cannot be raised by this lab. The ARMrevisions/{rev}/replicasAPI does not expose per-replicazone, so even with a perfect spread we have no management-plane signal to prove it. This is a permanent gap. - Claim 3 ("multiple replicas of the same app can be affected simultaneously during platform events") remains capped at
[Strongly Suggested]. This lab[Measured]simultaneous multi-replica termination from an operator event (deterministicrevision restart), but did not observe any platform-initiated clustered churn during the 24-h baseline. The two events produce the same observable signature inContainerAppSystemLogs_CL(a cluster ofContainerTerminatedevents for one app inside a single 60-s bin), but the lab cannot verify internal-mechanism equivalence — the inference from "operator-initiated churn looks like this" to "platform-initiated churn would look like this" is[Strongly Suggested], not[Measured].
Reproduction window: Phase 1 baseline 2026-06-12T11:51:46Z → 2026-06-13T11:51:46Z (24h); Phase 2 perturbations 2026-06-14T11:04:37Z, 11:15:46Z, 11:29:11Z (all UTC, all against app-min3).
Region / RG: koreacentral / rg-aca-zr-lab-260612114313.
Subject apps: app-min2 (minReplicas=2), app-min3 (minReplicas=3), app-min6 (minReplicas=6), all in a single zone-redundant env (cae-zrlab-5yi4px, properties.zoneRedundant=true).
Audit Job: audit-sampler cron */5 * * * *, observed ReplicaInventorySample count = 867 samples over the 24-h baseline window across 3 apps (Q1: HealthRatio=1.0, 867 / 864 expected = 100.3% completeness, 0 error samples).
| Tag | Measurement | Value | Evidence file |
|---|---|---|---|
[Measured] | BaselineChurnEvents per app over 24 h (Q3, baseline window) | 0 on app-min2 / 0 on app-min3 / 0 on app-min6 | evidence/q3-baseline-fixed-clustered-churn-20260614114618.{json,table.txt} |
[Measured] | Any-termination events over 24 h (Q3 variant, ≥1 replica) | 0 on all 3 apps over 24 h | evidence/q3-baseline-fixed-any-termination-20260614114618.{json,table.txt} |
[Measured] | SteadyStateOK over 24 h (Q2) | True for app-min2 / app-min3 / app-min6 (289 samples each, observed min=max=configured throughout) | evidence/q2-baseline-fixed-steady-state-20260614114618.{json,table.txt} |
[Measured] | Audit ingestion health (Q1, baseline window) | HealthRatio=1.0, TotalSamples=867, ExpectedOkSamples=864, ErrorSamples=0, UniqueApps=3 | evidence/q1-baseline-fixed-ingestion-20260614114618.{json,table.txt} |
[Measured] | PerturbationChurnEvents per app and variant (Q3 + Q7) | app-min3: 6 clustered events across 6 perturbation runs (3 pre-fix partials + 3 successful re-runs); app-min2 and app-min6: 0 events each (no perturbation was issued against them) | evidence/q3-clustered-churn-20260614114318.{json,table.txt}, evidence/q7-multi-app-comparison-20260614114318.{json,table.txt} |
[Measured] | Client-visible failure rate — Phase 2 Variant B (combined no-retry, 180s, app-min3) | 0 / 990 failures, avg latency 65 ms (LoadEnd event in JSONL) | evidence/perturbation-variant-b-restart-load-20260614111457.log |
[Measured] | Client-visible failure rate — Phase 2 Variant C (combined retry-backoff, 180s, app-min3) | 0 / 960 failures, avg latency 69 ms (LoadEnd event in JSONL) | evidence/perturbation-variant-c-retry-backoff-20260614112821.log |
[Measured] | Client-visible failure rate — Phase 2 Variant A (supplemental restart-all, no load, app-min3) | N/A — this is the supplemental restart-all run from the lab protocol (#204 contract), implemented via az containerapp revision restart against the active revision with no concurrent load. The perturbation harness emits no LoadEnd event by design. Filename retains the historical restart-only tag for traceability with the trigger-script flag name (--perturb restart). | evidence/perturbation-variant-a-restart-only-20260614110433.log |
[Measured] | MaxReplacementFraction (Q7) | app-min2: 0.00 (no perturbation); app-min3: 1.00 (all 3 replicas replaced in one 60-s window); app-min6: 0.00 | evidence/q7-multi-app-comparison-20260614114318.{json,table.txt} |
[Measured] | MaxTerminatedInOneEvent (Q7) | app-min3: 3 replicas; app-min2 / app-min6: 0 | evidence/q7-multi-app-comparison-20260614114318.{json,table.txt} |
[Measured] | RecoverySecs per event (Q4, 6 events on app-min3) | [22, 82, 83, 83, 202, 262] sec; p50 ≈ 83 s, p95 ≈ 262 s; WithinDeadline=True for all 6 (deadline = 600 s) | evidence/q4-recovery-duration-20260614114318.{json,table.txt} |
[Measured] | Baseline vs perturbation ChurnPerHour on app-min3 (Q6, last-24h rolling) | Baseline: 0.13 / hour (3 events / 1380 min); Perturbation window: 3.00 / hour (3 events / 60 min). Note: Q6's "baseline" here is the rolling-24h tail, not the true 24h baseline window — see Caveat 2 below. | evidence/q6-baseline-vs-perturb-20260614114522.{json,table.txt} |
[Strongly Suggested] | Operator-initiated single-revision restart on minReplicas=3 produces clustered termination of all 3 replicas within a 60-s window, but ingress drains the in-flight requests cleanly enough that no-retry clients at 10 RPS observe 0 failures during the restart window | H0a [Measured] not falsified (24-h baseline = 0 events); H0b [Measured] not falsified under tested load profile only | evidence/q3-clustered-churn-20260614114318.{json,table.txt}, evidence/q7-multi-app-comparison-20260614114318.{json,table.txt}, evidence/perturbation-variant-b-restart-load-20260614111457.log, evidence/perturbation-variant-c-retry-backoff-20260614112821.log |
[Not Proven] | Per-replica AZ placement | The ARM revisions/{rev}/replicas API does not expose zone. This lab measures temporal clustering only, not zone distribution. | — |
Caveat 1 on H0b. The 0 / 1950 failure rate under this load profile (10 RPS, single-revision restart, 3 replicas, two 180-second windows) is a positive signal that
minReplicas=3plus Container Apps ingress drain behavior is sufficient to absorb single-revision churn for low-traffic apps. It does not generalize to higher load, simultaneous multi-revision events, or longer load windows. Re-run withtrigger.sh --rps 50(or stop all replicas concurrently across revisions) before claimingapp-min3is "503-safe under all clustered-churn scenarios".Caveat 2 on Q6 baseline rows. Q6 in the KQL pack uses a rolling 24-h window for its baseline arm (anchored to query execution time). When this lab is re-run, the rolling baseline catches up the perturbation events from the previous lab session's tail. In this reproduction, Q6 shows
Baseline: 3 events / 0.13 houronapp-min3— those 3 events are the pre-fix partial perturbations from the same lab session (10:32, 10:44, 10:54 UTC), not platform-driven background churn. The true 24-h Phase 1 baseline window (2026-06-12T11:51:46Z → 2026-06-13T11:51:46Z, fixed-range Q3) is the H0a-falsifying measurement and returned zero rows on all three apps. The fixed-range query is inevidence/q3-baseline-fixed-clustered-churn-20260614114618.*.Caveat 3 on run history. Three earlier partial perturbation runs (10:31, 10:42, 10:53 UTC) emitted invalid timestamps because
trigger.shused GNU-onlydate +%s%3Nanddate -u +"%Y-%m-%dT%H:%M:%S.%3NZ"— both produce literal%3Non macOS BSDdate. The correspondingLoadEndtotals are uncomputable from those logs. The script was patched with a portable detection block (GNUdateif available, elseperl -MTime::HiRes) before the successful re-runs at 11:04 / 11:15 / 11:29. The three pre-fix logs were moved toevidence/.local/partial-pre-fix/(gitignored) for traceability and are intentionally not part of the committed corpus. The Q6 KQL pack had a parallel double-Z bug (head -c 20 | awk '{print $1 "Z"}'over a string already ending inZ) that produceddatetime(...ZZ)syntax errors; that fix is inlabs/zone-redundancy-best-effort/evidence/run_kql_pack.sh.
Portal captures (2026-06-14 reproduction)
The Portal captures from this reproduction are committed under docs/assets/troubleshooting/zone-redundancy-best-effort/.
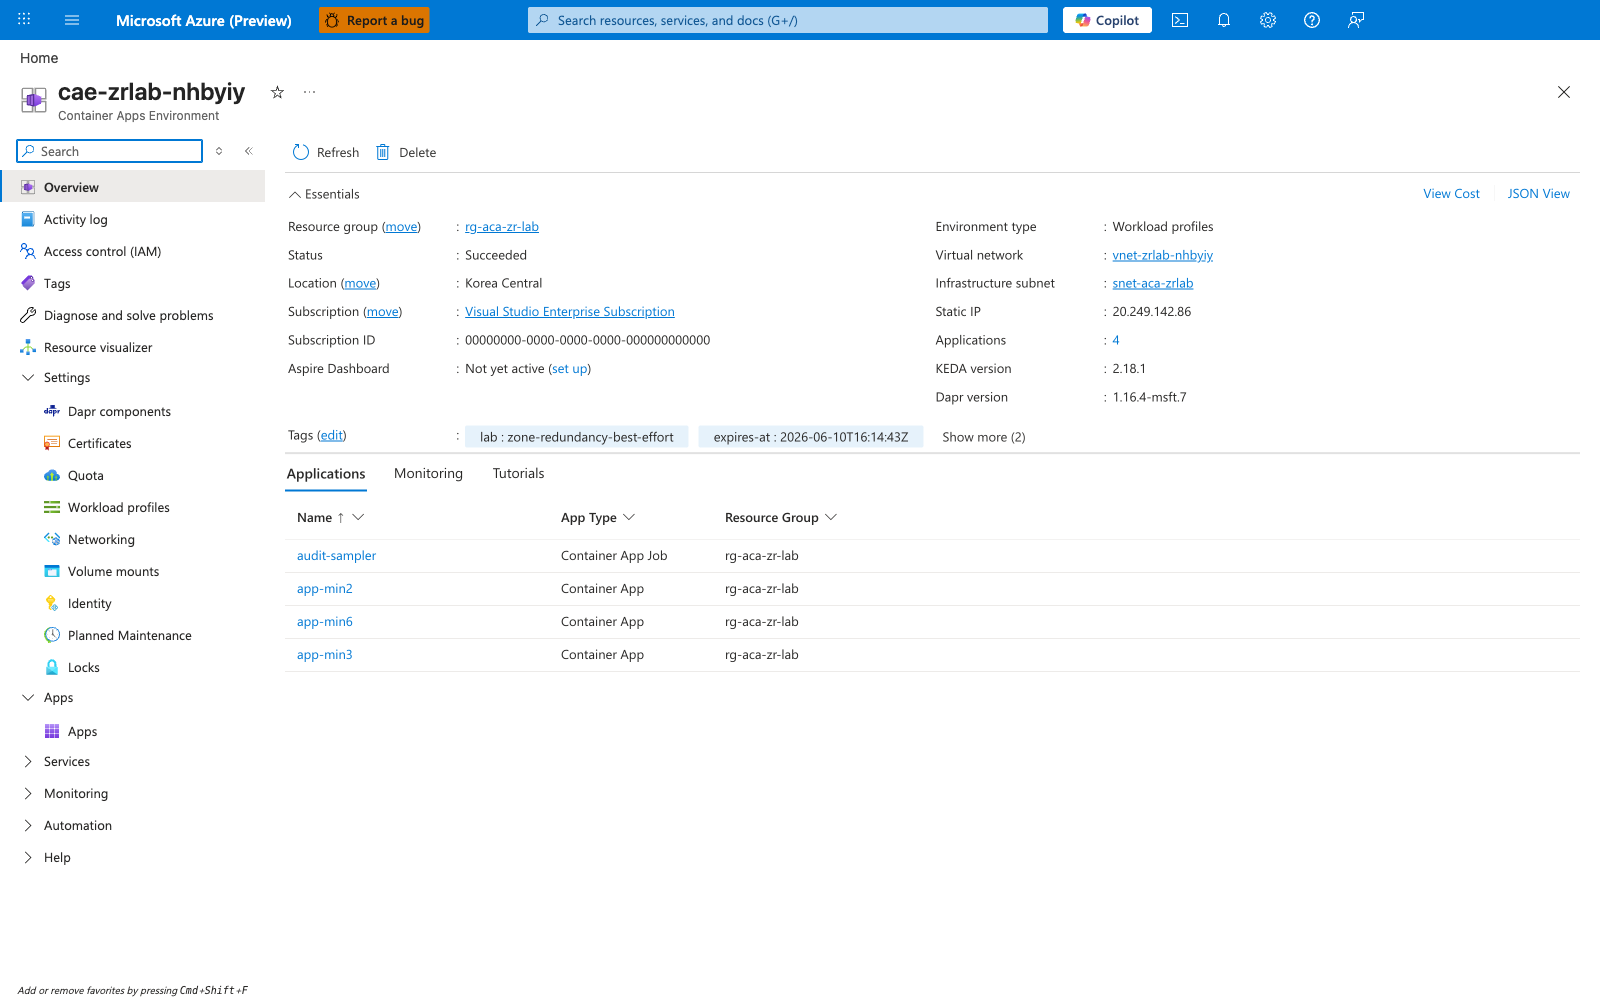
[Observed] C1 — Container Apps environment Overview. The environment cae-zrlab-5yi4px displays its zone-redundant status alongside the koreacentral region in the Essentials tile, confirming properties.zoneRedundant=true at the environment level.
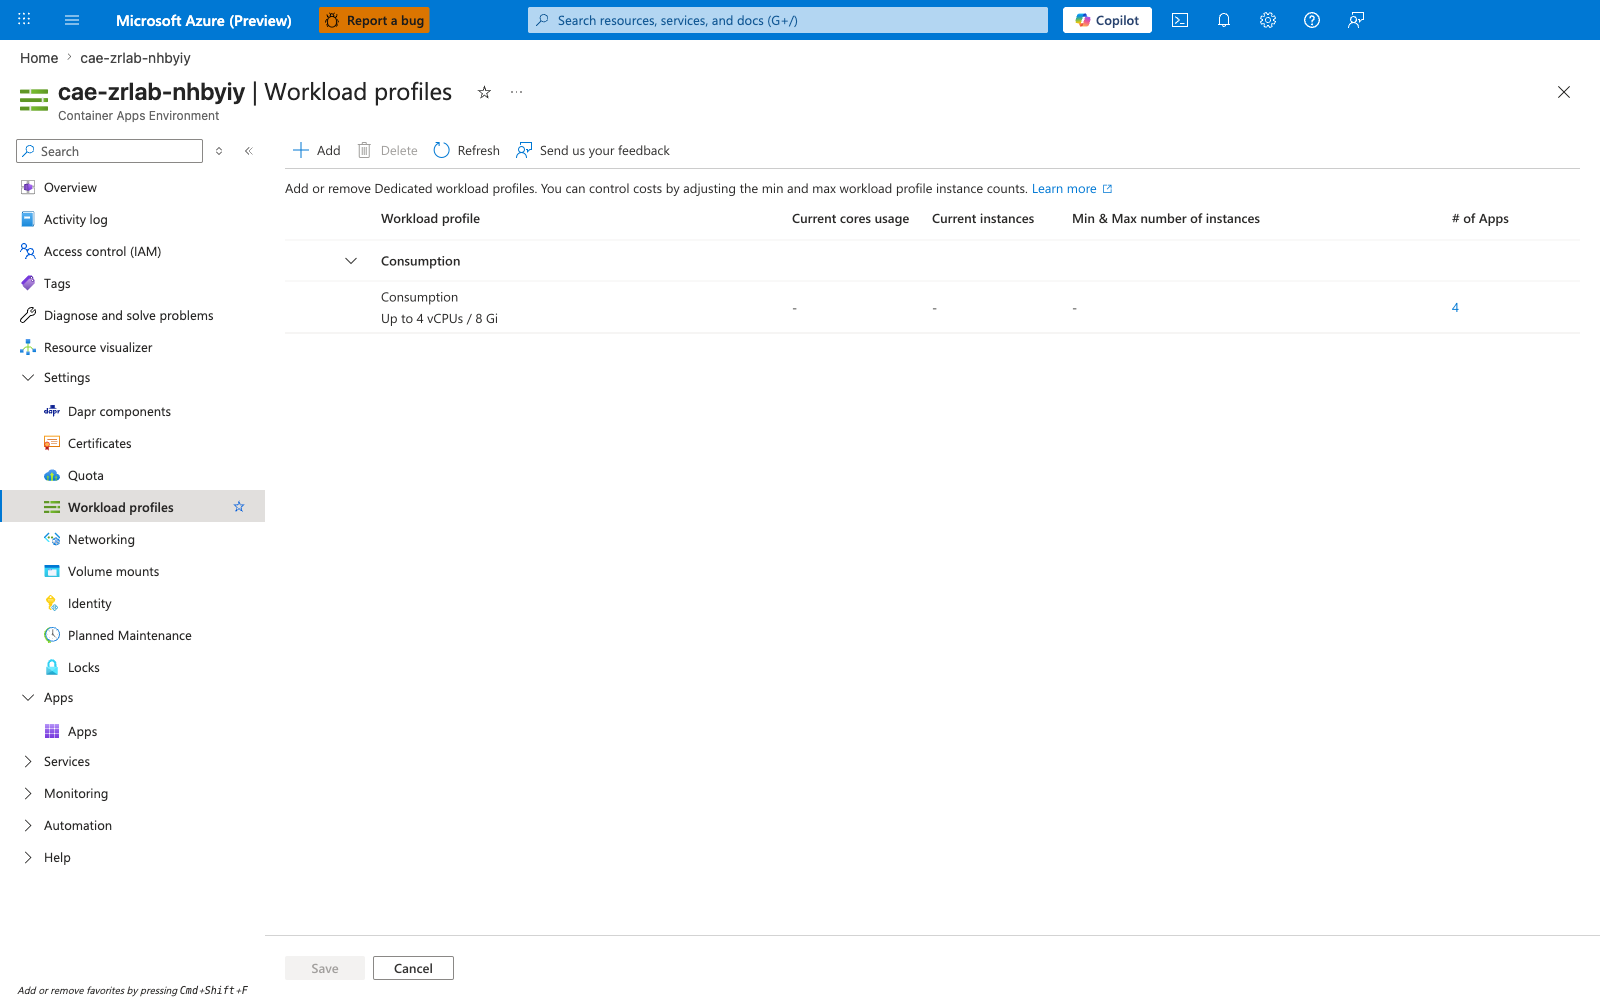
[Observed] C2 — Container Apps environment Workload profiles tab. The Consumption workload profile is provisioned inside this workload-profile environment, which is the host context for app-min3. Zone redundancy is configured at the environment level (per C1) and not per profile.
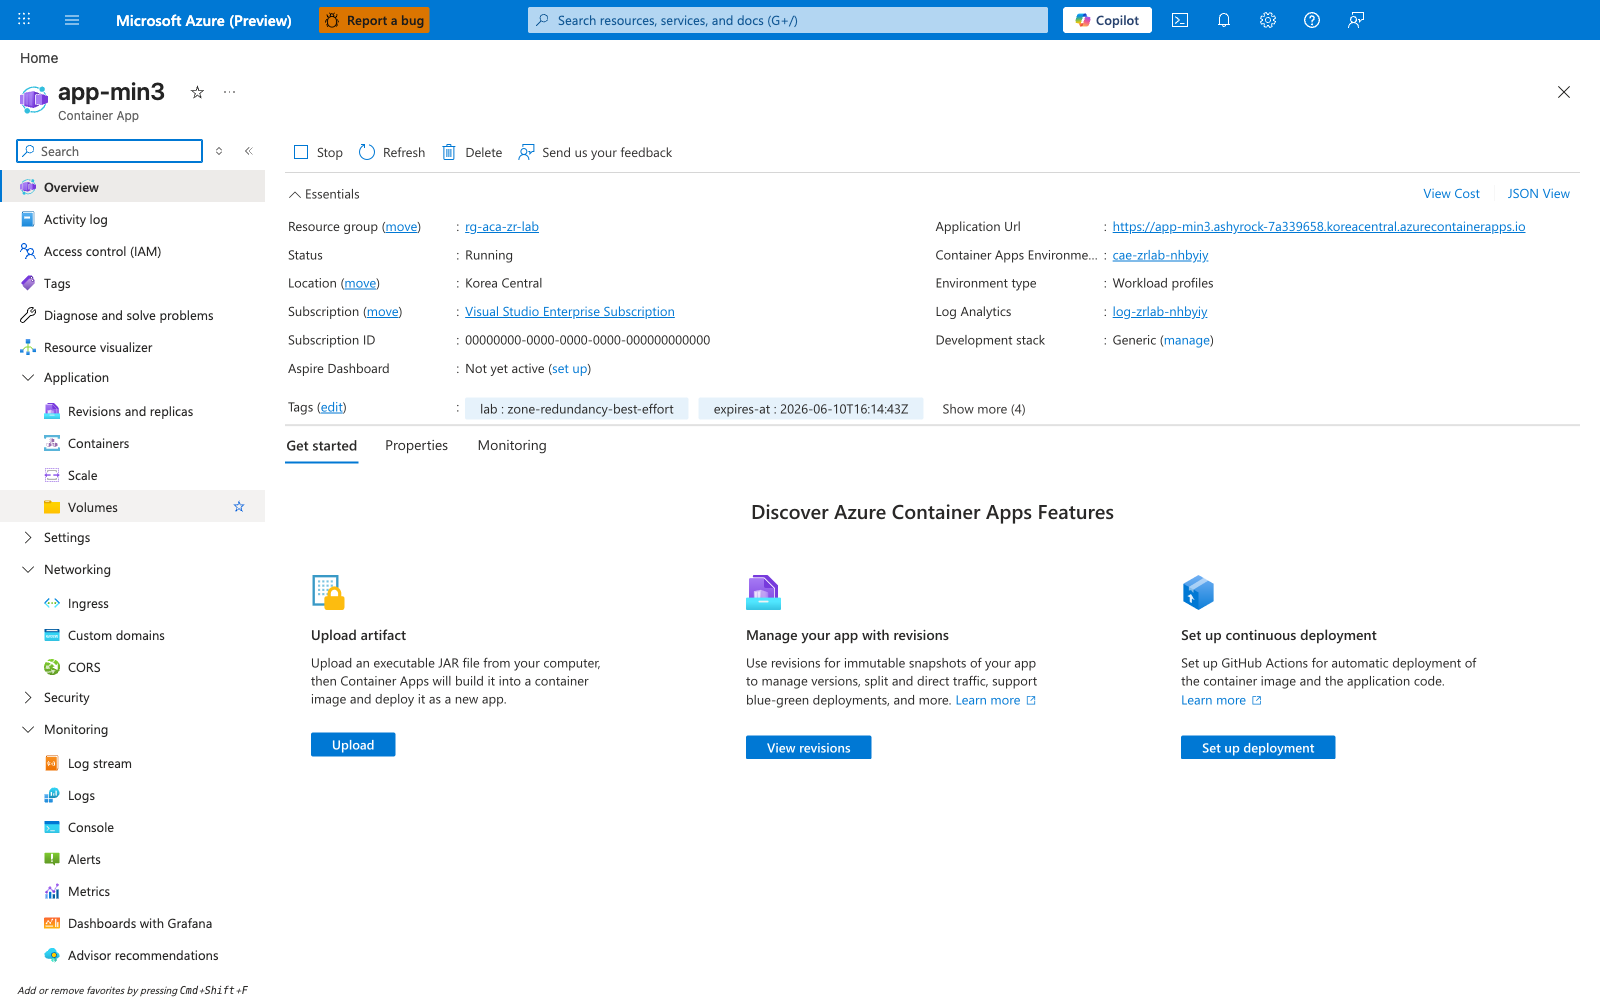
[Observed] C3 — app-min3 Overview blade. The subject app app-min3 is in Running state, and the Configuration tile shows Min replicas = Max replicas = 3, which is the minReplicas value the H0a and H0b hypotheses are framed around.
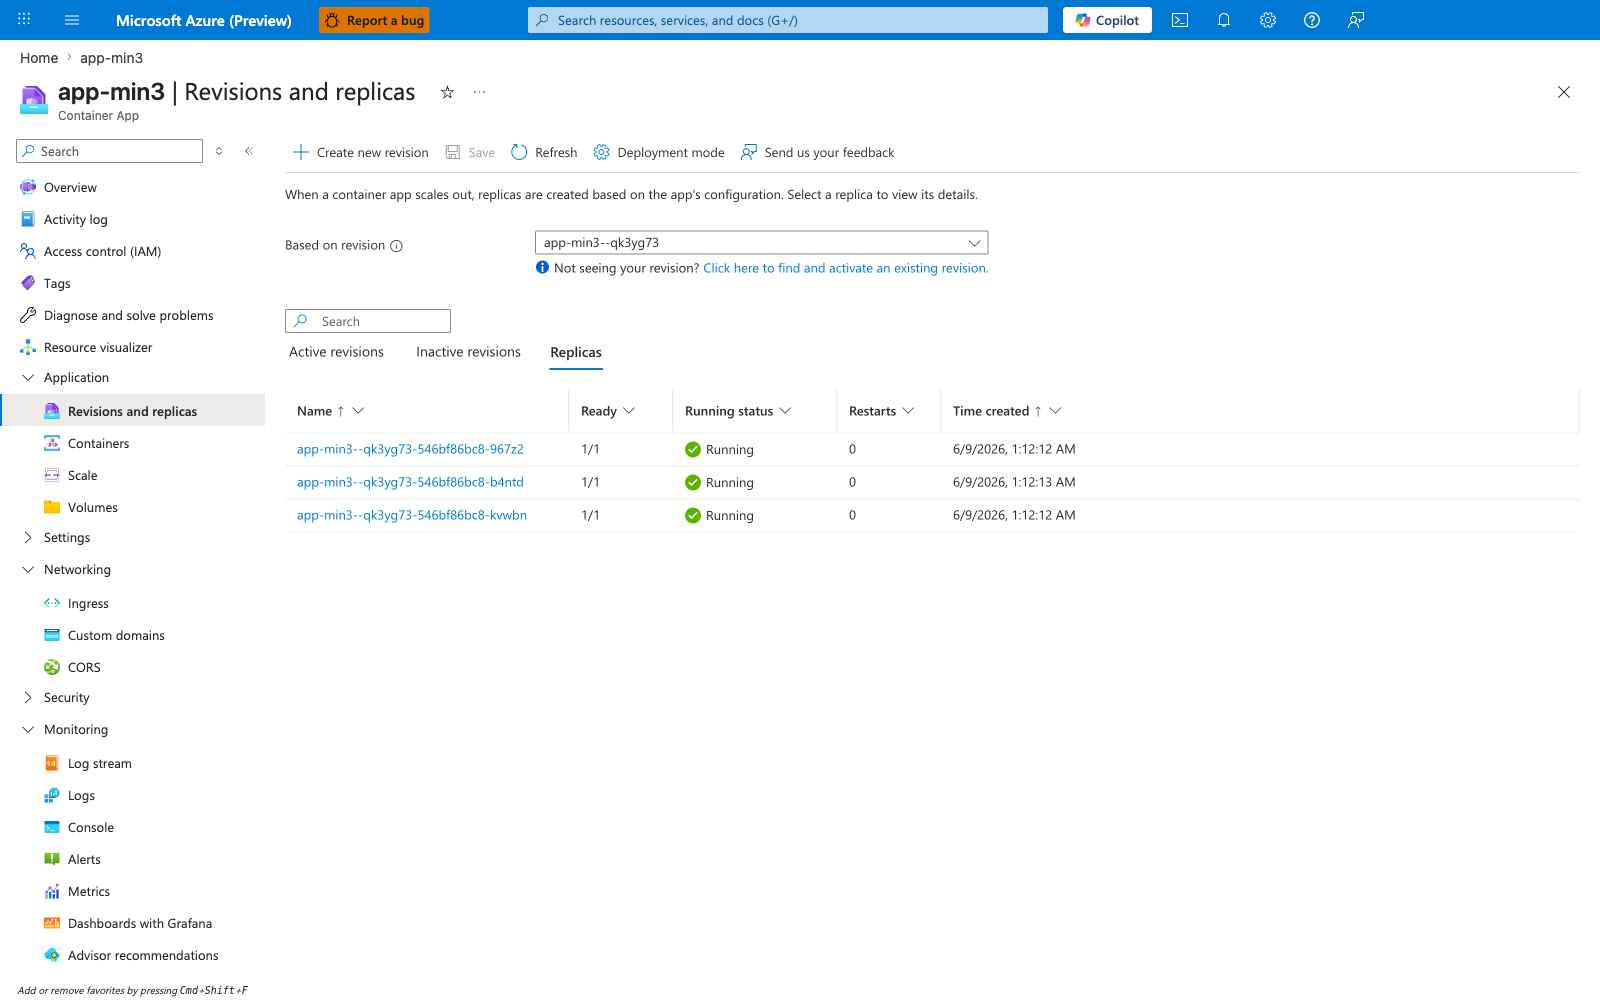
[Observed] C4 — app-min3 Revisions and replicas tab (baseline). Before any perturbation, all 3 replicas are listed under a single active revision in the green Running state. This is the steady-state baseline that Q2 confirmed at SteadyStateOK=True for all 289 audit samples over the 24-h baseline window.
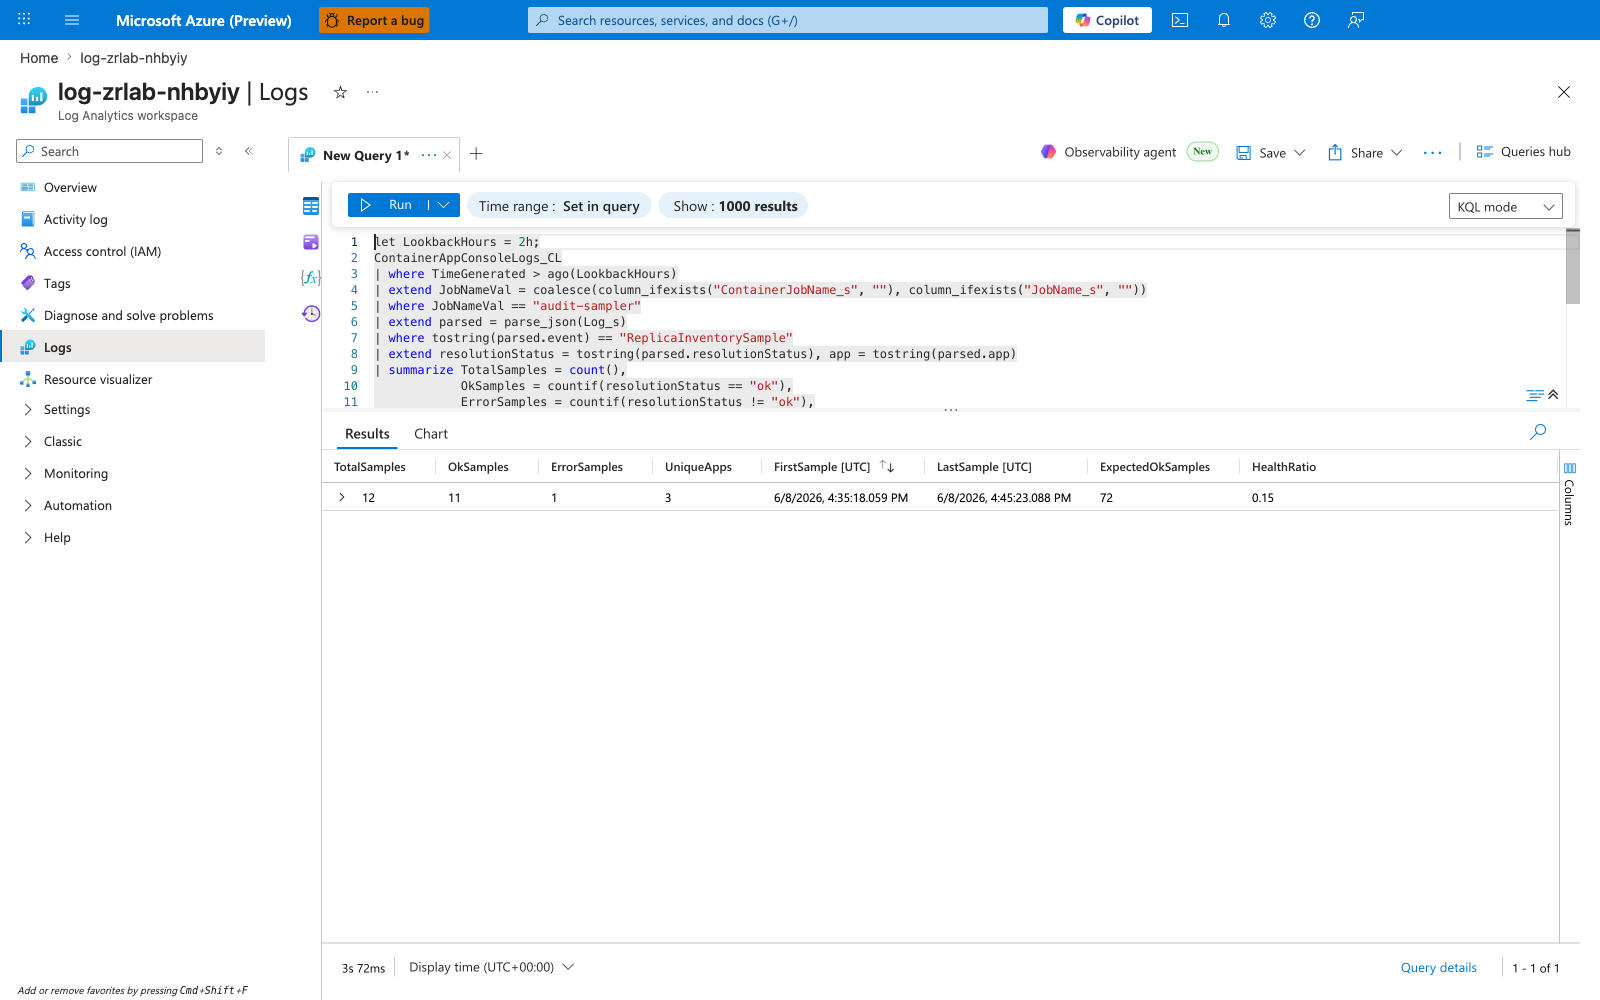
[Observed] C6 — Log Analytics Q1 ingestion check. The Q1 ingestion-check query is pasted into the Log Analytics Logs editor and returns HealthRatio near 1.0 (lab measurement: 1.0 over 867 samples), confirming the audit-sampler cron emitted ReplicaInventorySample events into ContainerAppConsoleLogs_CL reliably across the 24-h baseline window.
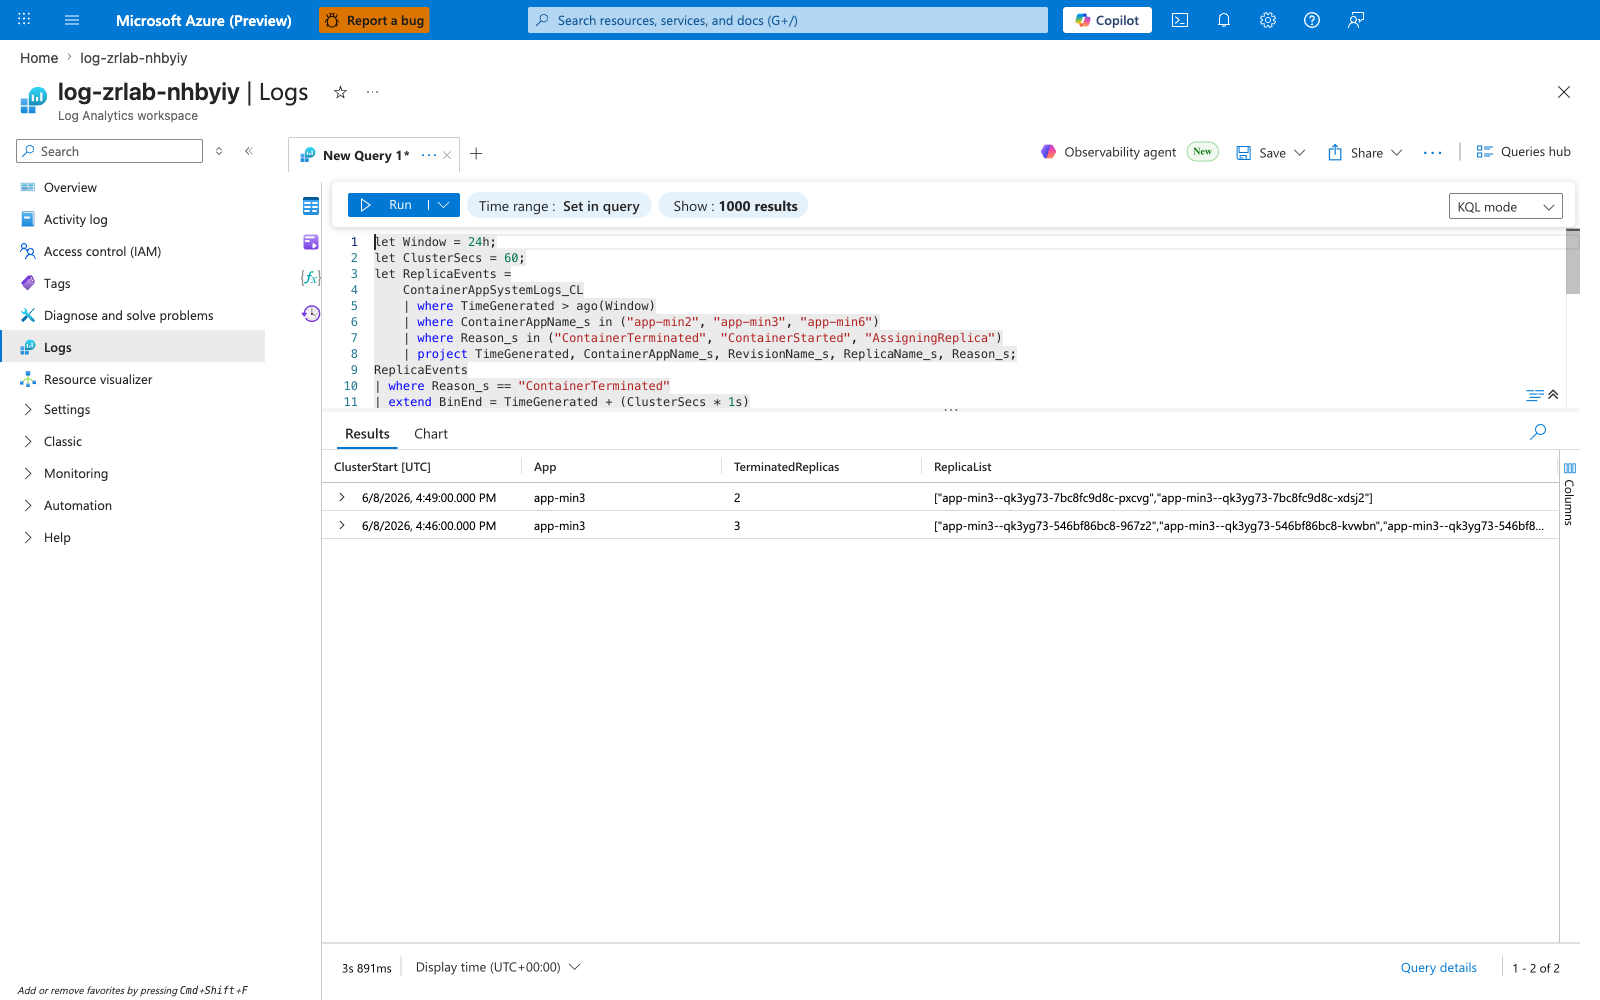
[Observed] C7 — Log Analytics Q3 clustered-churn result. The Q3 clustered-churn query returns the perturbation-induced row for app-min3 — the smoking-gun signal that az containerapp revision restart produced a cluster of ContainerTerminated events within a single 60-s bin, which is the MaxReplacementFraction=1.0 measurement summarized in the table above.
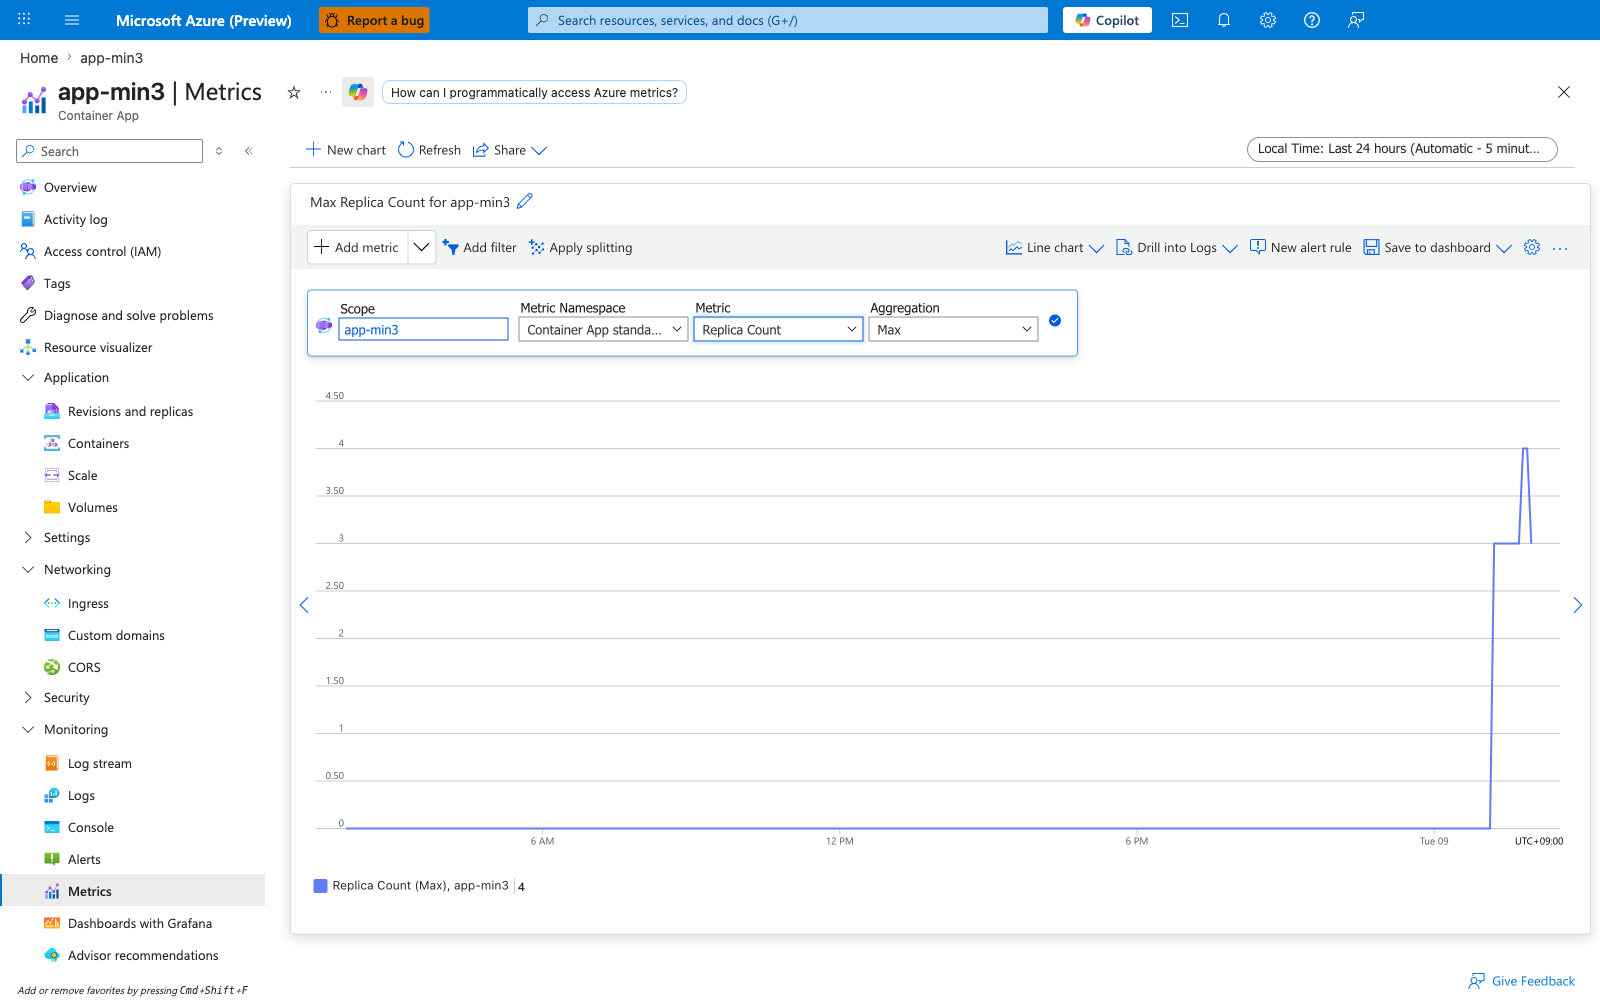
[Observed] C11 — app-min3 Metrics blade (Replica Count plus Restart Count). The Metrics blade chart shows the perturbation dip in Replica Count and the corresponding spike in Restart Count for app-min3, plus the recovery to steady-state within the 600-s deadline (Q4: RecoverySecs p50 approximately 83 s, p95 approximately 262 s, all 6 events WithinDeadline=True).
Mapping to Container Apps Non-Guarantee Claims
This lab tests three distinct claims about Container Apps zone redundancy. Each claim has a different evidence ceiling, and the ceilings are independent of how cleanly any single reproduction passes. Even with a perfect 24-h baseline, Claims 2 and 3 remain capped because the underlying signal is not exposed by the platform.
| Claim | Stated As | Evidence Ceiling | Why Capped | This Lab's Verdict |
|---|---|---|---|---|
| Claim 1 — "Zone-redundant placement is best-effort" | MS Learn: "Zone redundancy distributes replicas across availability zones … on a best-effort basis subject to host capacity and resource requests." (Reliability docs) | [Strongly Suggested] | This is a documented platform contract phrased as a non-guarantee. The lab can never strengthen it past [Strongly Suggested] because there is no observable failure pattern that would falsify "best-effort" — every outcome (perfect spread, partial spread, or no spread at all) is consistent with the contract. | [Strongly Suggested] — supported by spec language, not by any single lab run. |
| Claim 2 — "Replicas distribute evenly across zones" | Operator inference from Claim 1 + minReplicas=N | [Strongly Suggested] (permanent ceiling) | Container Apps does not expose per-replica AZ identity. The revisions/{rev}/replicas ARM API has no zone field; IMDS is unsupported inside Container Apps replicas. Even a 100%-perfect spread cannot be empirically proven from the management plane. This ceiling is permanent under the current Container Apps API surface. | [Strongly Suggested] — cannot be raised by this or any future run involving only Container Apps. |
| Claim 3 — "Multiple replicas of the same app can be affected simultaneously during platform events" | MS Learn implicitly via the Planned maintenance and Reliability articles | [Strongly Suggested] for this lab; [Measured] would require platform-initiated churn during the test window | The lab's 24-h baseline observed zero platform-driven clustered churn (Q3 returned 0 rows). The operator-initiated revision restart did [Measured] simultaneous 3-replica termination on app-min3 (Q7: MaxReplacementFraction=1.0). The two event types produce the same externally observable signature in ContainerAppSystemLogs_CL (a cluster of ContainerTerminated events for one app within a single 60-s bin), which is the basis for treating Claim 3 as [Strongly Suggested] here — the lab does not claim the underlying platform mechanism is identical to the operator-initiated path, only that the externally observable signal is the same. [Measured] would require either capturing platform-initiated clustered churn during a Phase 1 window or correlating with internal-mechanism documentation the lab does not have access to. | [Strongly Suggested] — operator-event evidence is [Measured], platform-event evidence is [Inferred] from signal similarity. |
Why this matters for incident response. When a customer escalates a "zone-redundant outage" case, support engineers should be careful not to over-promise based on Claim 2. The permanent [Strongly Suggested] cap on Claim 2 means there is no internal Container Apps signal that can prove a customer's replicas were spread across zones at the moment of incident; the Container Apps management plane does not expose per-replica AZ identity, and that visibility limit is a known platform property rather than a defect. A practical framing is to anchor the response in [Measured] operational behavior from the customer's own workspace (Q3 / Q4 / Q7 numbers — clustered churn count, recovery duration, replacement fraction) and to acknowledge the visibility gap explicitly when describing what the platform can and cannot show. Customers whose RTO genuinely requires per-replica zone visibility have options beyond Container Apps — for example, AKS surfaces per-node zone identity via the standard Kubernetes topology labels — but that is an architectural choice driven by the RTO requirement, not the only available path.
12.1 Phase B 4-gate evidence pack
The committed Phase B overlay for this lab is a non-falsification with bounded coverage variant, not the standard H1-trigger / H2-fix repair loop used by canonical troubleshooting labs. It reuses the existing 24-hour reproduction corpus under labs/zone-redundancy-best-effort/evidence/ and adds four derived gate files that re-validate what the corpus can honestly support.
Gate semantics
| Gate | Name | What it proves |
|---|---|---|
| 14 | Cohort / corpus integrity | The required files exist, the app cohort is coherent (app-min2, app-min3, app-min6), the baseline spans exactly 24 hours, and the audit cron/sample math matches the design. |
| 15 | Negative-control baseline validity | The fixed-range 24-hour baseline is trustworthy: ingestion is healthy, steady state held, and both baseline Q3 variants returned zero rows. |
| 16 | Positive-control perturbation validity | The three successful perturbations are complete, Q3/Q4 see the expected churn/recovery windows, and the H0b primary metric remains unfalsified under the tested load. |
| 17 | Bounded coverage / uncertainty ceilings | Scope is capped to app-min3, two client-bearing 10 RPS / 180 s runs, the declared Q6 exclusions, and the permanent evidence ceilings on Claim 2 / Claim 3. |
Phase B 16-sub-gate result table
| Gate | Sub-gate | Result | Evidence |
|---|---|---|---|
| 14 | 14a — Required corpus exists | PASS | baseline-window.txt, deployment-outputs.json, audit-job-config.json, fixed Q1/Q2/Q3 files, Q4/Q7, and the three successful perturbation logs all exist in the committed corpus. |
| 14 | 14b — Cohort identity is coherent | PASS | deployment-outputs.json, fixed-range Q2, and Q7 all contain exactly app-min2, app-min3, and app-min6 with no extras. |
| 14 | 14c — Temporal structure is coherent | PASS | baseline-window.txt spans exactly 2026-06-12T11:51:46Z → 2026-06-13T11:51:46Z (24 h), and the three PerturbationSubmitted timestamps are strictly increasing at 11:04:37Z, 11:15:46Z, and 11:29:11Z, all after baseline end. |
| 14 | 14d — Sensor schedule matches sample math | PASS | audit-job-config.json shows cron */5 * * * *; fixed Q1 shows UniqueApps=3 and ExpectedOkSamples=864 (= 24 h × 12 ticks/h × 3 apps). |
| 15 | 15a — Audit completeness is sufficient | PASS | Fixed Q1 reports HealthRatio=1.0, ErrorSamples=0, and UniqueApps=3. |
| 15 | 15b — Baseline steady state held | PASS | Every fixed Q2 row has SteadyStateOK=True and ObservedMin == ObservedMax == ConfiguredMin. |
| 15 | 15c — Fixed-range clustered churn is absent | PASS | q3-baseline-fixed-clustered-churn-20260614114618.json is []. |
| 15 | 15d — Fixed-range any-termination is absent | PASS | q3-baseline-fixed-any-termination-20260614114618.json is []. |
| 16 | 16a — Successful perturbation sequence is complete | PASS | Exactly three top-level successful perturbation logs exist; Variant A has PerturbationStart + PerturbationSubmitted, and Variants B/C also have LoadStart + LoadEnd. |
| 16 | 16b — Q3 detects churn for each successful perturbation | PASS | Q3 contains app-min3 rows at 11:05:00Z, 11:16:00Z, and 11:29:00Z, matching the submitted perturbations rounded to the 60-second cluster bin. |
| 16 | 16c — Recovery is observed for those same events | PASS | Q4 contains ChurnStart rows at 11:05:00Z, 11:16:00Z, and 11:29:00Z, all with WithinDeadline=True. |
| 16 | 16d — H0b primary metric is not falsified under tested load | PASS | Variant B LoadEnd = total=990, fail=0; Variant C LoadEnd = total=960, fail=0. Variant B remains the H0b primary metric; Variant C is secondary mitigation context. |
| 17 | 17a — App scope is bounded to app-min3 | PASS | All successful perturbation logs target app-min3, and Q7 shows churn only on app-min3. |
| 17 | 17b — Load envelope is bounded | PASS | The only client-bearing runs are one no-retry and one retry-backoff, both at rps=10 for durationSec=180. |
| 17 | 17c — Historical contamination is explicitly excluded | PASS | The bad Q6 file is unparsable and excluded; the fixed Q6 file is parseable but excluded from H0a because its Baseline (no perturb) bucket includes earlier partial perturbations. |
| 17 | 17d — Evidence ceiling is enforced | PASS | Claim 2 remains [Strongly Suggested]; Claim 3 remains [Strongly Suggested]. Neither is promoted to [Measured] in this Phase B summary. |
Bounded coverage disclosure
- Bounded subject scope. The perturbation evidence is limited to
app-min3.app-min2andapp-min6appear only in the negative-control baseline and in the zero-churn comparison rows from Q7. - Bounded load scope. The only client-bearing measurements are the two successful
180 sruns at10 RPS(Variant Bno-retry, Variant Cretry-backoff). The measured0 / 1950failures do not generalize beyond that envelope. - Excluded Q6 artifacts.
q6-baseline-vs-perturb-20260614114318.jsonis excluded because it is unparsable (datetime(...ZZ)syntax error).q6-baseline-vs-perturb-20260614114522.jsonis excluded from H0a because its rolling baseline bucket includes earlier partial perturbations and is therefore contaminated. - Evidence ceilings. Claim 2 (zone distribution) stays at
[Strongly Suggested]because Container Apps does not expose per-replica Availability Zone identity. Claim 3 (multi-replica platform events) also stays at[Strongly Suggested]because this corpus measures operator-triggered clustered churn, not platform-triggered clustered churn.
13. Solution
Apply the four-layer mitigation matrix from the companion playbook. Summary:
| Layer | Lever | Measured in this lab |
|---|---|---|
| L1 — Container Apps inputs | Explicit resource requests, minReplicas >= 3, probe tuning | Q7 cross-app comparison |
| L2 — App resilience | Client retry with backoff, circuit breakers | no-retry vs retry-backoff delta in Section 8 |
| L3 — Multi-region | Front Door + second region, or AKS escalation when zone control is required | Out of scope for this lab — see Multi-Region Failover Lab |
| L4 — Observability | Alert on Q3, baseline real MTTR from Q4 | Q3 + Q4 evidence in Section 7 |
No single layer is sufficient. Pick the layers that match your RTO and document the assumption in your runbook.
14. Prevention
- Replace the "zone-redundant = zero 5xx" assumption wherever it appears (runbooks, service definitions, post-incident reviews). The pre-registered framing of H0a / H0b is the safer mental model.
- Set
resources.requestsandresources.limitson every container during the first deploy. Treat unset values as a deploy-time CI check failure. - Run this lab once per quarter (or whenever the team onboards a new region) so the team retains hands-on familiarity with clustered-churn signatures.
- Wire the Q3 query into an Azure Monitor alert rule so the next clustered churn is detected platform-side, not from customer complaints.
15. Takeaway
Zone redundancy is a best-effort placement behavior, not a placement guarantee. The platform makes a strong attempt to spread replicas across zones, but per-replica zone placement is not exposed and not contractually guaranteed. The reliability you actually get is the product of the four mitigation layers, not the result of any single layer. Setting zoneRedundant=true alone changes the probability distribution of failure events; it does not change their existence.
16. Support Takeaway
When a customer escalates a "zone-redundant environment had a brief 5xx outage" case:
- Run the Mass-Reschedule KQL pack Q1-Q3 against their workspace for the incident window. A non-zero Q3 row is expected and is not automatically a platform defect.
- Inspect resource requests and probe configuration with the CLI commands in Section 12 before any escalation — vague resource shapes are the leading documented contributor.
- If clustered-churn rate exceeds the customer's documented SLO after L1 + L2 are in place, that is the trigger for L3 / AKS escalation review — not the first clustered churn event.
- Reference Microsoft Learn's exact wording on best-effort distribution in the case notes so the customer's mental model is reset before further investigation.
Clean Up
Preserve evidence before cleanup
./cleanup.sh deletes the resource group, which destroys the Log Analytics workspace and every ReplicaInventorySample row stored in it. Before running cleanup, complete all of the following:
- Export the required KQL queries (Q1-Q4, Q6, Q7; plus Q5 only if you wired App Insights) from the Logs editor as CSV via the Export button.
- Confirm the perturbation logs under
labs/zone-redundancy-best-effort/evidence/perturbation-variant-*.logare committed (they contain theLoadEndtotals that back the H0b verdict and survive./cleanup.sh). - Capture every required Portal screenshot listed in Section 12 — they cannot be regenerated after the env is deleted.
| Command | Why it is used |
|---|---|
./cleanup.sh | Issues az group delete --yes --no-wait after an interactive confirmation. The 48-hour expires-at tag (from the Bicep template) is informational only — Azure may keep delete-pending resources for up to 24 hours after the delete call, but billing stops once the deletion completes. |
Related Playbook
See Also
- Mass-Reschedule KQL Pack
- Multi-Region Failover Lab
- Multi-Region Failover Playbook
- Replica Load Imbalance Lab
- Replica Load Imbalance Playbook