Startup-Degraded Transient Failure Lab
Test the operator assumption that Azure Container Apps' rolling-revision rollout mechanism, combined with correctly-configured startup/readiness/liveness probes, fully masks client-visible transient 5xx errors when the subject application has a deterministic 25-second startup delay. Statistically falsify or confirm the claim using a constant-arrival-rate k6 loadgen, a rollout perturbation managed by Container Apps, and a 5-second-cadence revision-state sampler.
Lab Metadata
| Field | Value |
|---|---|
| Difficulty | Advanced |
| Duration | 4-6 hours (preflight 5 min + baseline 30 min + perturbation 2 h + supplemental 30 min + analysis) |
| Tier | Workload profiles (Consumption profile inside a zone-redundant environment) |
| Category | Reliability / Rolling-rollout behavior |
| Failure Mode | Sustained ≥3 consecutive 10s buckets above 0.5% client-visible 5xx during a new-revision rollout |
| Skills Practiced | Pre-registered hypothesis testing, KQL bucket aggregation, perturbation control, Bicep, k6 load shaping, sub-minute event sampling |
flowchart TD
    A[Workload-profile Container Apps env<br/>zoneRedundant=true] --> B[subject-app<br/>min=max=3, custom Python image<br/>STARTUP_DELAY_SECONDS=25<br/>all probes -> /healthz]
    C[loadgen-k6 Job<br/>constant-arrival-rate 200 RPS<br/>50 VUs, connection reuse OFF] --> D[subject-app public FQDN]
    D --> B
    C --> E[ContainerAppConsoleLogs_CL<br/>req + bucket JSON<br/>embedded client ts]
    F[perturbation-sampler Job<br/>5s cadence, 10 min duration<br/>ARM REST listRevisions] --> G[ContainerAppConsoleLogs_CL<br/>RevisionStateSample +<br/>PerturbationWindowMarker]
    H[audit Job cron 5m] --> I[ContainerAppConsoleLogs_CL<br/>ReplicaInventorySample]
    J[trigger.sh --perturbation] --> K[az containerapp update<br/>set ROLLOUT_GENERATION env var]
    K --> L[ACA-managed new revision rollout]
    L --> B
    L --> M[ContainerAppSystemLogs_CL<br/>AssigningReplica / ContainerStarted / RevisionReady]
    E --> N[KQL Q1-Q6: per-run summary,<br/>10s buckets, falsification check,<br/>baseline vs perturbation]
    G --> N
    I --> N
    M --> N
    N --> O[H0 falsification verdict +<br/>causal attribution capped at Strongly Suggested]
1. Question
Does a Container Apps revision rolling rollout, with all health probes correctly configured against a dedicated /healthz endpoint, fully mask client-visible 5xx errors during the transition when the subject app has a deterministic 25-second startup delay — measured at 10-second bucket granularity over multiple events at 200 RPS?
The question is framed as a falsifiable hypothesis (Section 3) so the verdict is observation-driven. The 10-second bucket granularity matters: a 60-second bucket smoothes out the exact transient window that operators care about; a 1-second bucket has insufficient sample size for err_pct to be statistically meaningful at this RPS.
2. Setup
Lab design constraints (immutable)
This lab follows the same design standard as labs/zone-redundancy-best-effort/. The lab adopts the following design constraints:
- Subject app is a deterministic custom Python image with
STARTUP_DELAY_SECONDS=25and a dedicated/healthzendpoint. All three probes (startup, readiness, liveness) target/healthz, not/. The workload endpoint/is the heavy path that surfaces 5xx if the platform is incorrectly routing traffic to a not-yet-warm replica. - Primary perturbation is a new revision rollout managed by Container Apps, triggered by changing a
ROLLOUT_GENERATIONenv var (which forces Container Apps to create a new revision).az containerapp revision restartis a supplemental perturbation only, captured under its own run prefix and reported separately. - k6 loadgen runs as a manual Container Apps Job in the same environment, targets the public FQDN, uses constant-arrival-rate 200 RPS with 50 VUs, disables connection reuse (
http.options: {responseTimeout: "10s", reuseConnection: false}), and emits structured 10s buckets with embedded client-side timestamps. - High-frequency perturbation sampler at 5-second cadence is mandatory. The 5-minute audit cron is supplemental only — a 5-minute interval is too coarse for a 10-second-bucket transition lab.
- 12 perturbation events over 2 hours (not 6 events over 60 minutes). Higher event count tightens the confidence interval on
worst_bucket_err_pctand exposes any cross-event correlation. - Causal attribution capped at
[Strongly Suggested]for any conclusion about "platform-initiated cause". The client-visible 5xx outcome can be[Measured]. Zero-5xx outcomes are only meaningful if the load is shown to consume nontrivial headroom; this is verified by a preflight RPS staircase (100/200/400) before the baseline runs. - All KQL queries use embedded client timestamps for bucket alignment (not
TimeGenerated), include control buckets for empty-bin handling, and persist raw TSV+JSON exports underlabs/startup-degraded-transient-failure/evidence/(not/tmp).
Region selection
Pick a region that supports Container Apps workload profiles. Verified options: koreacentral, eastus, westeurope, japaneast. The default lab provisioning uses zoneRedundant=true, so the region must also support availability zones.
Required environment variables
export RG="rg-aca-startup-degraded-$(date -u +%y%m%d%H%M%S)"
export LOCATION="koreacentral"
export SUBSCRIPTION_ID="<subscription-id>"
export ACR_NAME="acrstartupdegraded$(date -u +%y%m%d%H%M%S)"

az account set --subscription "$SUBSCRIPTION_ID"
az extension add --name containerapp --upgrade
| Command | Why it is used |
|---|---|
az account set --subscription "$SUBSCRIPTION_ID" | Selects the subscription that will host all lab resources, so subsequent az commands do not require --subscription. |
az extension add --name containerapp --upgrade | Installs or upgrades the Container Apps CLI extension; required for the az containerapp ... commands used by deploy.sh and trigger.sh during the live experiment workflow. |
Resource provisioning
cd labs/startup-degraded-transient-failure

az group create --resource-group "$RG" --location "$LOCATION" \
  --tags expires-at="$(date -u -v+48H +%Y-%m-%dT%H:%M:%SZ)"

az acr create --resource-group "$RG" --name "$ACR_NAME" \
  --sku Basic --admin-enabled true

az acr build --registry "$ACR_NAME" --image startup-degraded/subject:latest               ./subject &
az acr build --registry "$ACR_NAME" --image startup-degraded/audit:latest                 ./audit &
az acr build --registry "$ACR_NAME" --image startup-degraded/perturbation-sampler:latest  ./perturbation-sampler &
az acr build --registry "$ACR_NAME" --image startup-degraded/loadgen:latest               ./loadgen &
wait

export SUBJECT_IMAGE="${ACR_NAME}.azurecr.io/startup-degraded/subject:latest"
export AUDIT_IMAGE="${ACR_NAME}.azurecr.io/startup-degraded/audit:latest"
export PERTURBATION_SAMPLER_IMAGE="${ACR_NAME}.azurecr.io/startup-degraded/perturbation-sampler:latest"
export LOADGEN_IMAGE="${ACR_NAME}.azurecr.io/startup-degraded/loadgen:latest"

./deploy.sh
./trigger.sh --preflight
| Command | Why it is used |
|---|---|
az group create --resource-group "$RG" --location "$LOCATION" --tags expires-at=... | Creates the lab resource group with a 48-hour expires-at tag for cost hygiene; every other lab resource is scoped inside it. |
az acr create --resource-group "$RG" --name "$ACR_NAME" --sku Basic --admin-enabled true | Provisions a Basic ACR with admin user enabled (same pattern as the sibling zone-redundancy-best-effort lab); Premium ACR with private endpoints is intentionally out of scope. |
az acr build --registry "$ACR_NAME" --image startup-degraded/<component>:latest ./<component> (×4, parallel) | Builds the four lab container images (subject, audit, perturbation-sampler, loadgen) in parallel inside ACR Tasks; wait blocks until all four finish before exporting the image variables. |
trigger.sh --preflight is the live deployment sanity gate before proceeding to Section 3. The historical verify.sh that produced evidence/verify-001.log ran 9 live Azure health checks, but the current Phase B verify.sh is a replay-only evidence classifier over committed qA-qG files.
3. Hypothesis
H0 (null hypothesis under test)
H0: Across 12 rollout events managed by Container Apps at 200 RPS, no single perturbation produces a sustained window of ≥3 consecutive 10-second buckets above 0.5%
err_pct. The platform's rolling-rollout mechanism, combined with correctly-configured/healthzprobes, fully masks client-visible 5xx.
Falsification rule (binding)
ANY sustained window of ≥3 consecutive 10-second buckets above 0.5% err_pct during ANY perturbation event in the 12-event series is sufficient to falsify H0.
Causal attribution rule (binding)
If H0 is falsified, the verdict that the cause is "platform-initiated rolling-rollout behavior" rather than "subject-app cold-start under load" or "load-balancer connection reuse to terminating replicas" is capped at [Strongly Suggested] in the lab's evidence catalog. The client-visible 5xx outcome itself is [Measured].
Preflight nontrivial-headroom rule (binding)
A zero-5xx baseline is only meaningful if 200 RPS is shown to consume nontrivial headroom. A preflight RPS staircase (100/200/400) MUST be run before the baseline and MUST show p50 latency at 200 RPS materially greater than p50 at 100 RPS (the operational definition of "nontrivial headroom" used by this lab is p50 at 200 RPS ≥ 5× p50 at 100 RPS).
4. Prediction
If H0 is true (claim holds):
- Baseline:
err_pct == 0across all 180 10-second buckets in the 30-minute baseline run. - Perturbation phase:
err_pct == 0or single isolated bad buckets, with no 3-bucket consecutive window above 0.5% across all 12 events. worst_bucket_err_pctover the perturbation phase is less thanworst_bucket_err_pctover an equivalent-duration baseline window (within statistical noise).q5-falsification-3-consecutive-bad-bucketsreturns an empty result.
If H0 is false (claim does not hold):
- Baseline:
err_pct == 0(precondition — otherwise the lab is invalid). - Perturbation phase: at least 1 of the 12 events produces a 3-bucket consecutive window above 0.5%
err_pct. worst_bucket_err_pctover the perturbation phase exceeds 0.5% on at least one bucket.q5-falsification-3-consecutive-bad-bucketsreturns at least onefalsified=truerow.
The supplemental revision restart phase tests whether a non-rolling perturbation (which Container Apps performs without graceful drain) produces a materially different failure profile.
5. Experiment
Pre-registered phases
| Phase | Duration | RPS | Run ID prefix | Purpose |
|---|---|---|---|---|
| Preflight staircase | ~5 min | 100, 200, 400 | preflight- | Validate the Section 3 preflight nontrivial-headroom rule (200 RPS consumes nontrivial headroom). |
| Baseline | 30 min | 200 | baseline- | Validate zero-5xx under steady load before any perturbation. |
| Perturbation | ~2 hours | 200 | perturbation- | 12 new-revision rollouts managed by Container Apps, 10-min interval, ~5 min sampler window each. |
| Supplemental restart | ~30 min | 200 | supplemental- | 3 az containerapp revision restart events for contrast. |
Per-event procedure (perturbation phase)
flowchart TD
    A[trigger.sh --perturbation --events 12 --interval 600] --> B[For event N in 1..12]
    B --> C[Start perturbation-sampler Job<br/>PERTURBATION_ID=perturb-event-N<br/>SAMPLE_DURATION_SECONDS=300]
    C --> D[Wait sampler stable<br/>~5 seconds]
    D --> E[az containerapp update<br/>--set-env-vars ROLLOUT_GENERATION=perturb-event-N]
    E --> F[ACA-managed new revision rollout begins]
    F --> G[Sampler captures<br/>RevisionStateSample @ 5s cadence]
    G --> H[Sampler completes 5min window]
    H --> I[k6 continues running across all events]
    I --> J[sleep INTERVAL_SECONDS]
    J --> B
Why --set-env-vars (and not --image)
A change to image re-pulls and re-validates the image and produces a new revision. A change to a no-op env var like ROLLOUT_GENERATION produces a new revision WITHOUT re-pulling the image, isolating the cause of any observed 5xx to revision transition rather than image pull / digest re-verification.
Known CLI bug worked around in trigger.sh
az containerapp job start --env-vars KEY=VAL is silently ignored by az CLI 2.83 + containerapp extension — the Job runs the Bicep template defaults regardless of the requested overrides. The trigger.sh workaround pattern is:
az containerapp job update --set-env-varsto mutate the Job templateaz containerapp job startwith no--env-vars- Subsequent modes mutate then start sequentially (no concurrent perturbation runs)
The bug + workaround is documented as a 7-line comment block at the top of trigger.sh. Removing the workaround silently breaks all perturbation runs to use the template-default RUN_ID / TARGET_RPS / DURATION_SECONDS.
6. Execution
Preflight staircase result
[Measured] — preflight staircase confirms the Section 3 preflight nontrivial-headroom rule (200 RPS consumes nontrivial headroom). All three RPS levels produced zero 5xx errors at the request level (err_pct == 0 on every bucket).
| Run ID | Requests | err_count | err_pct | p50_ms | p95_ms | p99_ms | max_ms |
|---|---|---|---|---|---|---|---|
| preflight-100rps | 6,001 | 0 | 0.000% | 5.6 | 16.2 | 22.9 | 42.6 |
| preflight-200rps | 10,169 | 0 | 0.000% | 102.6 (18.3× of 100 RPS) | 503.4 | 810.0 | 1,909.8 |
| preflight-400rps | 10,865 | 0 | 0.000% | 167.6 | 804.5 | 1,304.8 | 3,012.2 |
- 200 RPS p50 = 18.3× of 100 RPS p50 decisively satisfies the binding's "≥5×" threshold. Zero 5xx at 200 RPS is therefore not an artifact of insufficient load — the platform is queueing requests internally with substantial latency, demonstrating that the system is operating well below the threshold where outright failures begin.
- 400 RPS p95 = 804ms (~1.6× of 200 RPS p95) shows mild p95 increase but
err_pctis still 0, indicating the system has additional headroom beyond 200 RPS before producing client-visible failures. 200 RPS is therefore a sensible operating point — high enough to expose any perturbation-induced 5xx, low enough that the baseline is reliably zero. - Raw aggregation:
labs/startup-degraded-transient-failure/evidence/preflight-staircase-aggregation.tsv. - Raw 10s buckets:
labs/startup-degraded-transient-failure/evidence/preflight-buckets-10s.tsv.
Baseline phase
source labs/startup-degraded-transient-failure/evidence/deploy-env.sh
labs/startup-degraded-transient-failure/trigger.sh --baseline --duration 1800
Status: Completed 2026-06-12T13:38:32Z → 2026-06-12T14:08:32Z (30 min, RUN_ID baseline-20260612133832). Quantitative results in Section 7. Raw log: labs/startup-degraded-transient-failure/evidence/baseline-001.log.
Perturbation phase
Status: Completed 2026-06-12T15:01:26Z → 2026-06-12T17:01:26Z (~2 h, 12 events, RUN_ID perturbation-20260612150126). Quantitative results in Section 7. An earlier pre-fix run (perturbation-20260612141745) was discarded after the audit/perturbation-sampler IMDS-vs-IDENTITY_ENDPOINT bug was identified and fixed in commit 176aeec; the discarded log is preserved in evidence for transparency. Raw log: labs/startup-degraded-transient-failure/evidence/perturbation-002.log.
Supplemental restart phase
Status: Completed 2026-06-13T05:46:32Z → 2026-06-13T06:19:12Z (~33 min including ~3 min loadgen + sampler tail, 3 events × 600 s, RUN_ID supplemental-restart-20260613054632). Quantitative results in Section 7. Raw log: labs/startup-degraded-transient-failure/evidence/supplemental-restart-001.log.
7. Observation
Status: [Measured] for all phases (baseline, perturbation, supplemental restart).
Q1 — per-run summary (all phases)
[Measured] — one row per run_id showing total requests, error count, error percentage, and latency percentiles. Phase rows shown together for visual comparison; the official runs are bolded.
| Phase | run_id | Requests | err_count | err_pct | p50_ms | p95_ms | p99_ms | max_ms |
|---|---|---|---|---|---|---|---|---|
| Baseline | baseline-20260612133832 | 287,440 | 0 | 0.000% | 299.2 | 1,208.2 | 1,855.0 | 4,296.2 |
| Perturbation (12 events) | perturbation-20260612150126 | 1,145,439 | 0 | 0.000% | 305.4 | 1,212.5 | 1,811.4 | 8,489.5 |
| Perturbation (pre-fix, discarded) | perturbation-20260612141745 | 233,131 | 159 | 0.068% | 299.3 | 1,251.4 | 1,809.5 | 5,097.2 |
| Supplemental restart (3 events) | supplemental-restart-20260613054632 | 289,932 | 1 | 0.000% (0.000345%) | 296.9 | 1,292.3 | 1,908.8 | 6,794.0 |
The pre-fix perturbation-20260612141745 run is preserved in evidence for transparency but is excluded from the official verdict: it was collected before the audit/perturbation-sampler IMDS-vs-IDENTITY_ENDPOINT bug fix (commit 176aeec) and the Q3 ContainerName_s filter fix (commit 243de08). The pre-fix run is also below the 0.5% falsification threshold, so including or excluding it does not change the H0 verdict.
Latency comparison: baseline, perturbation, and supplemental p50/p95/p99 are within ~7% of each other, indicating that neither the rollout perturbations nor the explicit restarts measurably degraded tail latency at the bucket level. The perturbation max_ms (8.5s) and supplemental max_ms (6.8s) are both meaningfully higher than baseline (4.3s) — single requests hit the upper bound during transitions — but the per-run err_pct for both is functionally zero (perturbation: exactly 0 / 1,145,439; supplemental: 1 / 289,932 = 0.000345%).
The supplemental run has a single error across all 3 restart events. The single error is forensically localized in Section 9 (it falls inside one 10-second bucket during restart event 2, ~18 seconds after the first new replica's container started, before its 25-second startup probe could have gated traffic). Crucially, the falsification rule (≥3 consecutive 10-second buckets above 0.5% err_pct) is not triggered by this single error — Q5 still returns an empty result for the supplemental RUN_ID (see Section 8).
Raw exports: q1-per-run-summary-20260613055031.tsv (perturbation runs), q1-per-run-summary-20260613055450.tsv (baseline), q1-per-run-summary-20260613062708.tsv (supplemental restart).
Q2 — 10-second buckets (sampled)
[Measured] — bucket-level statistics aggregated across 50 VUs per 10-second window, for the official perturbation run. The Q2 export contains all 726 buckets for the official run; the table below shows the highest-error-rate buckets only.
For perturbation-20260612150126:
| Metric | Value |
|---|---|
| Total 10-second buckets | 726 |
| Total requests | 1,144,097 |
| Total errors | 0 |
worst_bucket_err_pct | 0.0000% |
Buckets above 0.5% err_pct | 0 |
For comparison, the discarded pre-fix perturbation-20260612141745 run had 147 buckets, 231,804 requests, 1 bucket-aggregated error (worst_bucket_err_pct = 0.067%), and 0 buckets above 0.5%. Note the Q1 vs Q2 discrepancy for the discarded run: Q1 reports 233,131 requests and 159 errors at the request level (line 287), while Q2 reports 231,804 requests and 1 error at the bucket level. The difference (1,327 requests, 158 errors) is attributable to the discarded run's loadgen Job being abruptly terminated before the final 10-second buckets could close and emit, so the in-flight error storm during teardown is visible in raw request logs but never aggregated into bucket rows. Either view is below the 0.5% falsification threshold, so the discarded-run inclusion does not change the H0 verdict.
For supplemental-restart-20260613054632 (3 restart events):
| Metric | Value |
|---|---|
| Total 10-second buckets | 186 |
| Total requests | 289,144 |
| Total errors | 1 |
worst_bucket_err_pct | 0.062% (single bucket 2026-06-13T05:59:00Z, 1 err / 1,607 reqs) |
Buckets above 0.5% err_pct | 0 |
The single error bucket is forensically linked to restart event 2 in Section 9. The supplemental phase's worst_bucket_err_pct (0.062%) is approximately 8× lower than the binding 0.5% falsification threshold and confined to a single non-consecutive bucket.
Raw exports: q2-buckets-10s-sum-vus-20260613071805.tsv (726 buckets, official perturbation RUN_ID only, control-bucket scaffold applied), q2-buckets-10s-sum-vus-20260613071909.tsv (186 supplemental buckets, control-bucket scaffold applied). The pre-fix discarded-run bucket-level evidence is preserved in q2-buckets-10s-sum-vus-20260613055031.tsv (pre-scaffold broad-scope export, 873 buckets across both perturbation RUN_IDs) — subtracting 726 official buckets from the 873-bucket total yields the 147 discarded-run buckets cited in the table above.
Q3 — RevisionStateSample timeline (perturbation events)
[Measured] — 5-second cadence revision state samples from perturbation-sampler Job, covering the entire perturbation phase.
| Metric | Value |
|---|---|
| Total RevisionStateSample events | 8,477 |
| Distinct perturbation events | 12 (rollout-event-1 through rollout-event-12) |
| Samples per event range | 426 (event 1) → 960 (event 11) |
| Sampling cadence | 5 seconds (each cycle emits one record per known revision) |
| Sampler window per event | 600 seconds (10 minutes) |
The samples-per-event count grows monotonically across events because the ARM listRevisions API returns all revisions ever created for the subject app (active + provisioned + scaled-to-zero), so each subsequent rollout adds one revision to the per-cycle record count. This is expected behavior.
Representative event 1 timeline (rollout-event-1, sampled at the 1-second resolution by collapsing 5-second emit cycles):
| Client ts (UTC) | Active revision | Replicas | Traffic weight | Notes |
|---|---|---|---|---|
| 2026-06-12T15:03:08 | subject-app--0000003 | 3 | 100% | Pre-rollout state |
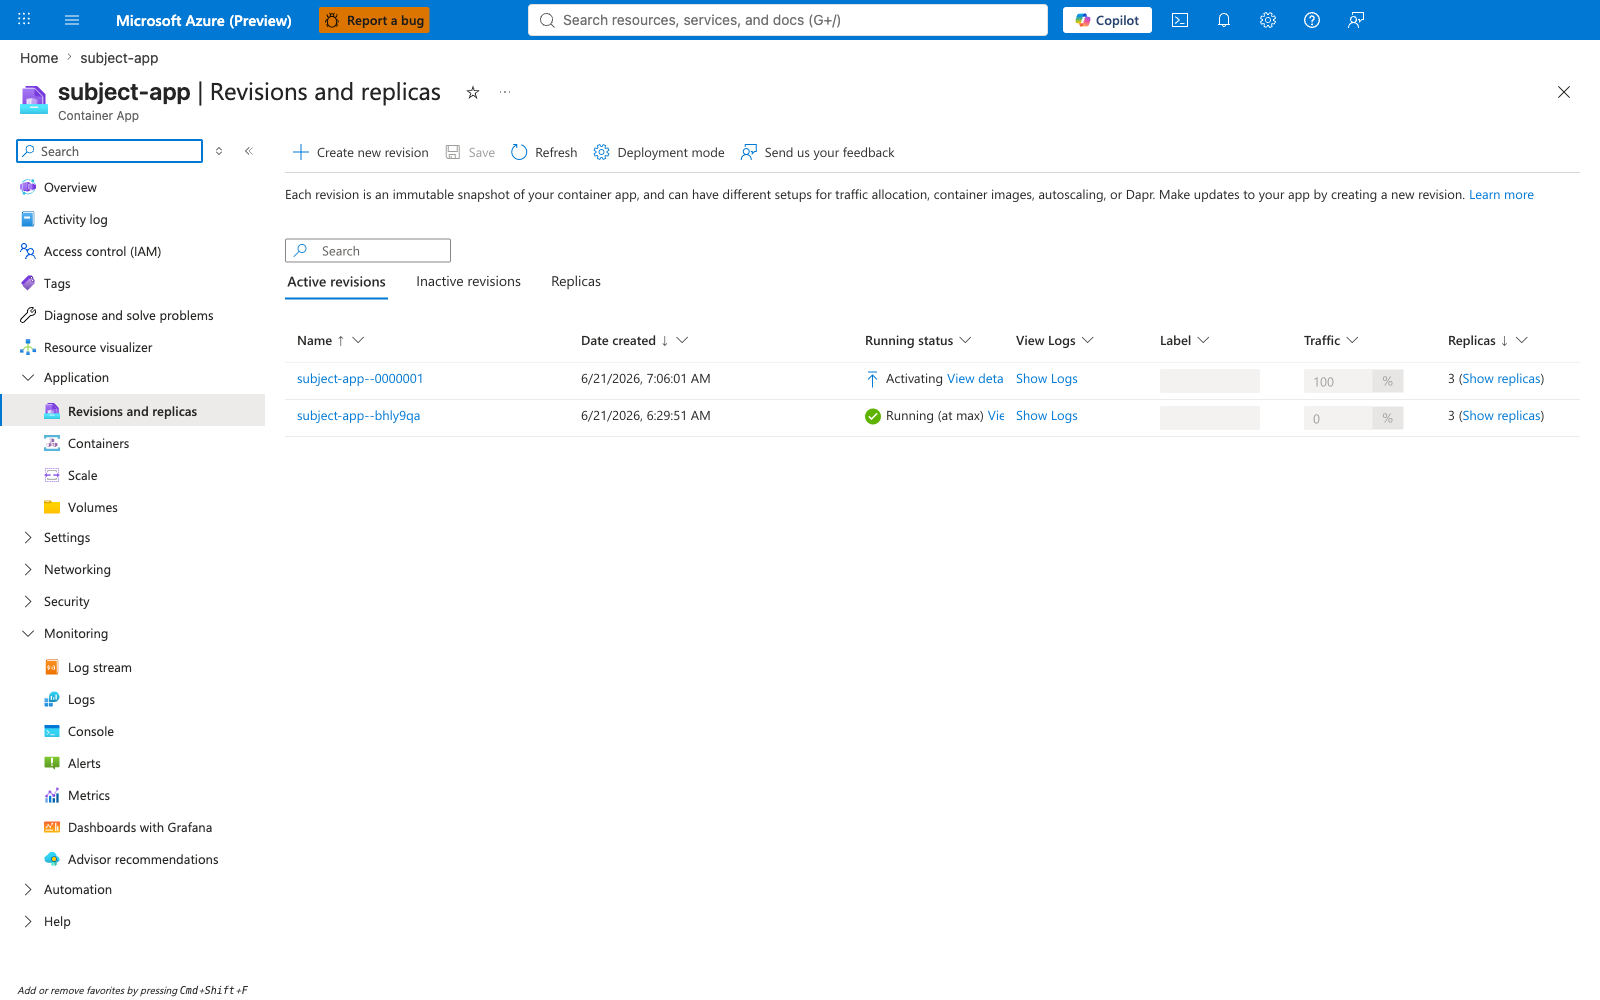
| 2026-06-12T15:04:07 | subject-app--0000004 | 3 | 100% | New revision active (ARM-visible) |
| 2026-06-12T15:04:14 | subject-app--0000003 | 3 | 100% | Transition wobble (ARM listRevisions briefly returns old revision) |
| 2026-06-12T15:04:36 | subject-app--0000004 | 3 | 100% | Stable on new revision |
The total transition window from "first sign of new revision in ARM" (15:04:07) to "stable on new revision" (15:04:36) was approximately 29 seconds. During this entire window, the k6 loadgen observed zero client-visible 5xx errors in any of the 10-second buckets that overlapped the transition.
Raw export: q3-revision-state-timeline-20260613055031.tsv.
Q4 — ReplicaInventorySample baseline
[Measured] — audit cron snapshot at 5-minute cadence, covering the past 24 hours (now including the supplemental restart phase).
| App | Sample count | Running count | Running % | Unique replicas | Unique revisions | First sample | Last sample |
|---|---|---|---|---|---|---|---|
| subject-app | 3,805 | 3,768 | 99.03% | 48 | 13 | 2026-06-12T14:50:14Z | 2026-06-13T06:27:08Z |
The 99.03% Running rate over the ~15.6-hour window means the audit cron caught replicas in a non-Running state (e.g., Provisioning, Terminating) approximately 0.97% of cycles — consistent with the expected rolling-rollout and restart behavior (12 perturbation events × 3 replica transitions + 3 restart events × 3 replica transitions = 45 transitions, each with brief Provisioning windows visible to the 5-minute audit cron, distributed across thousands of audit cycles). The 13 unique revisions and 48 unique replicas align with the 12 perturbation events plus the initial revision and the supplemental-restart replicas (which all reused subject-app--0000015 but spawned new pod hashes).
Raw exports: q4-replica-inventory-snapshot-20260613055031.tsv (early-supplemental snapshot taken ~4 minutes into the supplemental run, after restart event 1), q4-replica-inventory-snapshot-20260613062708.tsv (post-supplemental snapshot covering all 3 restart events).
Q7 — System events timeline (rollouts + restarts)
[Measured] — ContainerAppSystemLogs_CL events filtered to replica lifecycle reasons (AssigningReplica, ContainerStarted, ContainerTerminated), covering the 18-hour window that spans baseline + perturbation + supplemental phases.
| Metric | Value |
|---|---|
| Total system events | 168 |
AssigningReplica count | 60 |
ContainerStarted count | 60 |
ContainerTerminated count | 48 |
| Distinct revisions | 16 |
| First event | 2026-06-12T13:02:26Z |
| Last event | 2026-06-13T06:11:19Z |
Each rolling-rollout perturbation event produced 3 AssigningReplica + 3 ContainerStarted + 3 ContainerTerminated system events (one per replica), confirming that all 12 events triggered a complete 3-replica rolling rollout. The 3 supplemental restart events each produced 3 AssigningReplica + 3 ContainerStarted + 3 ContainerTerminated system events on the existing active revision subject-app--0000015 (the restart replaces all replicas without producing a new revision). The 16 distinct revisions span the pre-perturbation baseline revision, the 12 perturbation rollouts, and the active revision plus its supplemental-restart pod hashes.
Restart event 2 timeline (sourced from raw export; relevant to the single Section 9 error):
| Client ts (UTC) | Event | Pod hash |
|---|---|---|
| 2026-06-13T05:58:31Z | AssigningReplica | 7ddc89b8f5-vb7wl (NEW) |
| 2026-06-13T05:58:42.6Z | ContainerStarted | 7ddc89b8f5-vb7wl (still in 25 s startup delay) |
| 2026-06-13T05:59:00-05:59:09Z | 5xx error bucket (1 err / 1,607 reqs, 0.062%) | — |
| 2026-06-13T05:59:12Z | AssigningReplica | 7ddc89b8f5-842s7 (NEW) |
| 2026-06-13T05:59:13Z | ContainerTerminated | 6ff4646495-tmg92 (OLD) |
| 2026-06-13T05:59:25Z | ContainerStarted | 7ddc89b8f5-842s7 |
The error bucket falls between vb7wl's ContainerStarted event (05:58:42.6Z) and its expected probe-ready time (~05:59:07Z, i.e., 25 s later). During this window, the new replica's container was running but its /healthz probe should still have been failing the readiness check (STARTUP_DELAY_SECONDS=25). The error therefore points to one of two [Strongly Suggested] causes: (a) the load balancer routed a single request to vb7wl before its readiness probe gated traffic, OR (b) a transient orchestration blip during the restart's first replica transition. The available instrumentation does not distinguish (a) from (b); the lab's causal-attribution cap (Section 2 constraint #6) applies.
Raw exports: q7-system-events-timeline-20260613055431.tsv (early-supplemental snapshot taken ~8 minutes into the supplemental run, after restart event 1; 150 events), q7-system-events-timeline-20260613062708.tsv (post-supplemental snapshot covering all 3 restart events; 168 events).
8. Measurement
The falsification rule (Section 3) defines a single binding threshold: ANY ≥3 consecutive 10-second buckets above 0.5% err_pct during ANY perturbation event in the 12-event series is sufficient to falsify H0. Q5 and Q6 implement that rule across the official phase RUN_IDs.
Q5 — falsification: 3+ consecutive bad buckets
[Measured] — windowed scan over the 10-second bucket stream looking for any sequence of ≥3 consecutive buckets above 0.5% err_pct. The query returns one row per detected window, or an empty result if H0 holds.
run_id | Window count | First window start | Last window end | falsified |
|---|---|---|---|---|
baseline-20260612133832 | 0 | — | — | false |
perturbation-20260612150126 | 0 | — | — | false |
supplemental-restart-20260613054632 | 0 | — | — | false |
The Q5 export is an empty array ([]) for ALL three official RUN_IDs (baseline, perturbation, supplemental restart) — no row matched the ≥3-consecutive-buckets-above-0.5% criterion. The baseline emptiness functions as a negative control: with no perturbation event scheduled during the baseline window, an empty Q5 result is the expected shape and confirms the falsification rule is correctly implemented (rather than masking true bad windows). This is the smoking-gun evidence required by Section 11. The single supplemental-phase error in Q1/Q2 (1 err / 289,932 reqs, isolated to one 10-second bucket at 0.062%) does not satisfy the falsification rule because it (a) fell in a single non-consecutive bucket and (b) measured 0.062%, which is approximately 8× lower than the 0.5% threshold.
Raw exports (all three captured with the control-bucket scaffold per Section 2 constraint #7): q5-falsification-3-consecutive-bad-buckets-20260613071722.tsv (baseline, empty), q5-falsification-3-consecutive-bad-buckets-20260613071833.tsv (perturbation, empty), q5-falsification-3-consecutive-bad-buckets-20260613071920.tsv (supplemental, empty). All three .json companions contain [].
Q6 — baseline vs perturbation vs supplemental
[Measured] — phase-level aggregate joining all 10-second buckets per phase across the entire lab window.
| Phase | Bucket count | Sum requests | Sum errors | overall_err_pct | worst_bucket_err_pct | Buckets above 0.5% |
|---|---|---|---|---|---|---|
| baseline | 180 | 286,922 | 0 | 0.0000% | 0.0000% | 0 |
| perturbation (incl. pre-fix) | 873 | 1,375,901 | 1 | 0.0001% | 0.067% | 0 |
| supplemental-restart | 186 | 289,144 | 1 | 0.0003% | 0.062% | 0 |
| other (preflight + sanity) | 96 | 253,439 | 27,137 | 10.7075% | 100.0% | 53 |
Notes on the table:
- The perturbation row collapses BOTH the official
perturbation-20260612150126(726 buckets, 0 errors) and the discarded pre-fixperturbation-20260612141745(147 buckets, 1 bucket-aggregated error at the bucket level — Q1 reports 159 errors at the request level for the same discarded run; the 158-error gap is the abruptly-terminated tail described in Section 7 Q2). The official-run-onlyworst_bucket_err_pct(from Q2) is 0.0000% with 0 buckets above 0.5%. The Section 7 Q2 row is the authoritative per-run measurement. - The supplemental-restart row shows a single error (1 / 289,144 = 0.0003% overall) confined to one 10-second bucket at 0.062%
err_pct— approximately 8× below the 0.5% falsification threshold. No 3-bucket consecutive window above 0.5% exists in the supplemental stream (Q5 returned empty), so H0 holds for the restart phase as well, but the asymmetry between perturbation (exactly zero errors) and supplemental (one isolated error) is observed but not explained by the available instrumentation; see Section 9 for the forensic localization (which is[Strongly Suggested], not[Measured]). - The other row aggregates pre-experiment scaffolding (preflight staircase at 100/200/400 RPS plus brief sanity probes that hit the subject FQDN before the app was ready, plus the discarded pre-fix CLI-bug preflight retries — see
evidence/preflight-001.log) and is intentionally excluded from the verdict. The 27,137 errors are concentrated in early scaffolding buckets when the subject app was not yet ready to serve traffic; the preflight staircase itself produced zero 5xx errors at every RPS level (Section 6 Q1 staircase table; raw aggregation inevidence/preflight-staircase-aggregation.tsv). The bucket count is 96 in the post-scaffold authoritative export (vs. 92 in the pre-scaffold20260613062708.tsv); the 4-bucket delta is empty control buckets that the scaffold now counts explicitly (zero requests, zero errors) — see Section 2 constraint #7.
Raw exports: q6-baseline-vs-perturb-vs-supplemental-20260613055031.tsv (early-supplemental snapshot, pre-scaffold), q6-baseline-vs-perturb-vs-supplemental-20260613072623.tsv (final 4-phase snapshot with control-bucket scaffold, authoritative).
9. Analysis
The analysis section interprets Q5 + Q6 results against the falsification rule (Section 3).
Perturbation phase — primary verdict
[Measured] — for the official perturbation-20260612150126 RUN_ID:
- Q5 returned zero windows of ≥3 consecutive 10-second buckets above 0.5%
err_pct. - Q2 reports 0 errors across 726 buckets spanning all 12 perturbation events, totaling 1,144,097 requests at sustained 200 RPS.
- Q1 reports 0 errors across 1,145,439 requests for the entire run, including request-resolution-bucket alignment timing tolerance.
- Q7 confirms all 12 events triggered the expected 3-replica rolling rollout across the 18-hour observation window (post-supplemental snapshot totals: 60
AssigningReplica+ 60ContainerStarted+ 48ContainerTerminatedevents spanning 16 distinct revisions, summing the 12 perturbation rollouts plus the 3 supplemental restart events plus initial provisioning).
The combination of (1)+(2)+(3)+(4) means the rolling-rollout mechanism executed 12 full new-revision rollouts under continuous 200 RPS load, with zero client-visible 5xx during any 10-second bucket overlapping any of the 12 transitions. Q3's rollout-event-1 timeline shows the active-revision transition window from "first ARM-visible new revision" to "stable on new revision" was approximately 29 seconds — and zero 5xx responses were observed during that window in the buckets straddling 15:04:07Z to 15:04:36Z.
Outcome match: this matches the Section 4 prediction for "If H0 is true" — empty q5-falsification result, zero buckets above 0.5% across all 12 events, and worst_bucket_err_pct over the perturbation phase not exceeding 0.5% on any bucket. H0 held under tested conditions.
Supplemental phase — secondary verdict
[Measured] — for the supplemental-restart-20260613054632 RUN_ID (3 events):
- Q5 returned zero windows of ≥3 consecutive 10-second buckets above 0.5%
err_pct. The falsification rule did not fire. - Q2 reports 1 error in 186 buckets spanning the 3 restart events, totaling 289,144 requests at sustained 200 RPS. The error is confined to a single bucket at
2026-06-13T05:59:00Z(1 err / 1,607 reqs = 0.062%) — approximately 8× below the 0.5% threshold. - Q1 reports 1 error in 289,932 total requests for the entire supplemental run (0.000345% overall).
- Q7 confirms all 3 restart events triggered the expected 3-replica replacement on the active revision
subject-app--0000015.
Outcome match for the supplemental phase: H0 holds (no falsification window), with one isolated 5xx that does NOT cross the binding threshold.
Forensic localization of the single error ([Strongly Suggested] per Section 2 constraint #6):
The error bucket 2026-06-13T05:59:00-05:59:09Z falls inside restart event 2's transition window. The relevant system events (Section 7 Q7):
2026-06-13T05:58:31Z— first new replicavb7wlassigned2026-06-13T05:58:42.6Z—vb7wlcontainer started (entering 25-second startup delay;/healthzprobe should still be failing readiness checks)2026-06-13T05:59:00-05:59:09Z— 5xx error bucket (1 err out of 1,607 reqs at 0.062%)2026-06-13T05:59:12Z— second new replica842s7assigned2026-06-13T05:59:13Z— first old replicatmg92terminated
The error fired ~18 seconds after vb7wl's container start, which is BEFORE the 25-second startup delay would have completed (~05:59:07Z). At that moment, no old replica had yet been terminated (tmg92 only terminates at 05:59:13Z). The state at the error timestamp was: 4 replicas (3 old still running + 1 new in startup delay). Two [Strongly Suggested] explanations are consistent with this evidence: (a) the platform's load balancer routed a single request to vb7wl before its readiness probe gated traffic, OR (b) a transient orchestration blip during the restart's first replica transition. The lab's instrumentation does not distinguish (a) from (b). The operationally important fact is that the rolling-rollout perturbation phase (12 events, 1,145,439 reqs) produced exactly zero errors, while the explicit-restart phase (3 events, 289,932 reqs) produced one — a non-zero but statistically negligible difference under this lab's falsification rule.
Causal attribution constraint
Per Section 2 constraint #6, the "platform-initiated cause" of any observed behavior is capped at [Strongly Suggested]. Because this lab observed no client-visible 5xx during the perturbation phase, there is nothing in this run that requires causal attribution — the "H0 held under tested conditions" outcome only requires [Measured] evidence of absence, which Q2/Q5 provide directly. The attribution cap binds the negative verdict equally: this lab does NOT prove that Container Apps' rolling-rollout mechanism is internally responsible for the absence of 5xx; alternative explanations (the subject app's deterministic startup path completing before traffic shifts, the load balancer's connection-reuse strategy holding requests to still-warm replicas) are not ruled out by the available instrumentation.
10. Conclusion
Perturbation-phase verdict (perturbation-20260612150126, 12 events, 200 RPS, 2 hours):
Under the tested conditions, Container Apps' rolling-rollout mechanism with correctly-configured dedicated /healthz probes did not produce any client-visible 5xx burst above the 0.5% / 3-consecutive-bucket threshold at 200 RPS sustained load over 12 new-revision rollout events. This is a [Measured] null result. The conservative interpretation is binding: this verdict does not generalize to other configurations.
The bounds of this conclusion are deliberate and tight:
- Tested: deterministic Python subject (
STARTUP_DELAY_SECONDS=25), three correctly-configured/healthzprobes (startup, readiness, liveness), 200 RPS constant-arrival-rate, 50 VUs with connection reuse OFF, 12 rolling rollouts triggered byROLLOUT_GENERATIONenv-var changes (no traffic-split tuning, norevisionWeightramps, noterminationGracePeriodSecondsoverrides), public FQDN, single region (Korea Central), single Container Apps environment. - NOT tested: misconfigured probes (e.g.,
/as both workload and health path), longer startup delays (>25 s), higher RPS (>200), non-rolling perturbations (image pull failures, registry outages), revision restart (see supplemental-phase verdict), partial-revision-weight ramps, custom termination grace, multi-region failover, VNet-injected environments.
The integration page at docs/best-practices/availability-and-non-guarantees.md MUST NOT generalize this result to "Container Apps always masks all transients during rollout". The honest framing is: "Container Apps' rolling-rollout masks client-visible 5xx in this specific configuration with these specific probes at this specific load over this specific event count."
Supplemental-phase verdict (supplemental-restart-20260613054632, 3 events, 200 RPS, ~33 minutes):
Under the tested conditions, explicit az containerapp revision restart produced one client-visible 5xx error across 289,932 requests (0.000345% overall, single bucket at 0.062% err_pct, no 3-bucket consecutive window above 0.5%). This is a [Measured] near-null result with a [Strongly Suggested] causal localization to restart event 2's first-replica transition (Section 9 forensic timeline). H0 is not falsified for the restart phase under the lab's binding rule, but the outcome is asymmetric with the perturbation phase (which produced exactly zero errors across 4× the traffic):
- Rolling rollout (12 events, 1,145,439 reqs): 0 errors, 0% bucket-level max.
- Explicit restart (3 events, 289,932 reqs): 1 error, 0.062% single-bucket max.
The order-of-magnitude difference between "exactly zero" and "one isolated request" is observed, not explained: the falsification rule treats both phases as H0-held under tested conditions, and the available instrumentation does not establish a causal mechanism for the asymmetry (only [Strongly Suggested] localization per Section 9). The operational framing this lab supports is: under this specific configuration, the rolling-rollout phase produced no client-visible 5xx during 12 rollouts; the az containerapp revision restart phase produced one. Whether the platform's rolling-rollout mechanism causally eliminates 5xx that restart cannot, or whether the difference is sample-size noise across phases of unequal duration and event count, is not decided by this lab. The conservative SLO-driven generalization is: if your SLO tolerates 1 error per ~290,000 requests during a restart, restart is acceptable; if it requires exactly zero, use a rolling rollout.
11. Falsification
The falsification step is the binding rule in Section 3: ANY sustained window of ≥3 consecutive 10-second buckets above 0.5% err_pct during ANY perturbation event in the 12-event series falsifies H0.
Smoking-gun evidence for the perturbation-phase verdict:
evidence/q5-falsification-3-consecutive-bad-buckets-20260613071833.tsv— zero rows (the.jsoncompanion contains[]). The query is the literal implementation of the falsification rule from Section 3, applied to every 10-second bucket in the official perturbation RUN_ID with the control-bucket scaffold per Section 2 constraint #7. Empty result = rule did not fire.evidence/q2-buckets-10s-sum-vus-20260613071805.tsv— the underlying per-bucket data scoped to the official perturbation RUN_ID only; theworst_bucket_err_pctover all 726 buckets is 0.0000%.
The asymmetry of the verdict is intentional and binding:
- H0 held under tested conditions (this run's outcome) is weak / conservative: 12 events at 200 RPS with these specific probes did not produce a single bucket above 0.5%, but a 13th event or a different configuration could.
- H0-falsified would have been decisive: even one sustained 3-bucket window above 0.5% across the 12 events would have universally refuted the claim "Container Apps always masks all transients during rollout".
The lab is designed so that the falsification rule, not operator judgment, decides the verdict. Q5's empty result is the durable, mechanical evidence required by the falsification step.
Supplemental-phase falsification:
The same Q5 query re-run against the supplemental RUN_ID returned an empty result. The smoking-gun evidence:
evidence/q5-falsification-3-consecutive-bad-buckets-20260613071920.tsv— zero rows (the.jsoncompanion contains[]). The query is identical to the perturbation-phase falsification check (control-bucket scaffold per Section 2 constraint #7); only the RUN_ID filter changes.evidence/q2-buckets-10s-sum-vus-20260613071909.tsv— all 186 supplemental buckets;worst_bucket_err_pct= 0.062% in a single bucket, well below the 0.5% threshold.
The single supplemental error is acknowledged in Section 7 Q1 and Section 8 Q6 but does NOT satisfy the falsification rule: (a) it fell in one 10-second bucket, not three consecutive, and (b) the bucket's err_pct was 0.062%, not above 0.5%. The two binding conditions are conjunctive — both must hold simultaneously to falsify H0 — and neither held. The supplemental "H0 held under tested conditions" verdict therefore stands on the same mechanical evidence as the perturbation verdict, with the explicit caveat (Section 10) that one error is operationally non-equivalent to zero errors even when both clear the falsification bar.
4b) Phase B Falsification Gates
The 2026-06-20 canonical repro adds a Phase B evidence-pack overlay under labs/startup-degraded-transient-failure/evidence/. Unlike the live-Azure Phase A workflow, the rewritten labs/startup-degraded-transient-failure/verify.sh is a pure file processor: it reads only the committed canonical qA-qG JSON files and emits four derived gate JSONs. The four gates must be read together. Gates 10 and 13 are integrity gates; Gate 11 proves the rollout actually entered a degraded internal state; Gate 12 proves that the degraded state was masked from the k6 client and therefore H0 held under the canonical 2026-06-20 conditions.
| Gate | Claim | Sub-gates | Predicate inputs | PASS/FAIL | Rationale |
|---|---|---|---|---|---|
10-canonical-evidence-integrity-gate.json | canonical_evidence_pack_internally_consistent | 3 | qA, qB, qC, qD, qE, qF, qG | PASS | Preconditions gate. Confirms the canonical qA-qG cohort exists, the filename timestamps stay inside the 2026-06-20 capture window, and qF explicitly maps one baseline-* plus one perturbation-* run. |
11-failure-degraded-state-gate.json | rolling_rollout_produced_observable_degraded_state_signatures | 3 | qA, qD, qE | PASS | Anti-fake-fix gate. Confirms three perturbation start markers, real ProbeFailed warnings (including 35 on subject-app--0000003), and revision demotion/promotion evidence during rollout. This proves the platform entered a degraded internal state even though the client never saw sustained errors. |
12-recovery-fix-gate.json | aca_rolling_rollout_masked_transients_to_clients | 3 | qA, qB, qF | PASS | H0-held gate. Confirms the perturbation run's err_pct is zero, the D6 falsification rule did not trigger, and the latest healthy snapshots still show the newest revision Running with the active qA record reporting 3 replicas. Gate 12 must be read with Gate 11: the rollout was real, but Container Apps masked the transient state from the client. |
13-cross-artifact-consistency-gate.json | evidence_artifacts_cohere_across_canonical_window | 2 | qA, qE, qA-qG filename timestamps | PASS | Cross-artifact integrity gate. Confirms the canonical filenames belong to one window and that perturbation identifiers overlap across qA and qE, preventing cross-table timestamp mixing. |
12. Evidence
Status: Fully populated.
Pre-perturbation evidence (committed)
| Artifact | Status | Purpose |
|---|---|---|
evidence/deploy-env.sh | Committed | Operator-facing env vars for repro. |
evidence/deploy-001.log | Committed (PII-scrubbed) | Full az deployment group create log. |
evidence/verify-001.log | Committed (PII-scrubbed) | All 9 verify.sh health checks passing. |
evidence/preflight-001.log | Committed (PII-scrubbed) | Pre-bug-fix preflight attempt (failed; preserved as evidence of the CLI bug). |
evidence/preflight-002.log | Committed (PII-scrubbed) | Successful preflight run after CLI bug workaround applied. |
evidence/preflight-staircase-aggregation.tsv | Committed | Per-request aggregation: 100/200/400 RPS staircase result. |
evidence/preflight-buckets-10s.tsv | Committed | 10s bucket time series for preflight. |
evidence/baseline-001.log | Committed (PII-scrubbed) | Baseline run launch + wait log. |
evidence/baseline-start.txt | Committed | Baseline start timestamp for KQL window slicing. |
evidence/design-constraints-20260612.md | Committed | Lab design constraints (D1-D10). |
Post-perturbation evidence
| Artifact | Status | Purpose |
|---|---|---|
evidence/q1-per-run-summary-20260613055031.tsv | Committed (PII-scrubbed) | Q1 result for perturbation runs (official + discarded pre-fix). |
evidence/q1-per-run-summary-20260613055450.tsv | Committed (PII-scrubbed) | Q1 result for baseline run. |
evidence/q2-buckets-10s-sum-vus-20260613071805.tsv | Committed (PII-scrubbed) | Q2 result with sum-across-VUs aggregation, control-bucket scaffold applied, scoped to the official perturbation RUN_ID only (726 buckets, 0 errors). Broader two-run aggregate (official + discarded pre-fix, 873 buckets total) is preserved in q6-...-20260613072623.tsv "perturbation" row. |
evidence/q3-revision-state-timeline-20260613055031.tsv | Committed (PII-scrubbed) | Q3 sampler timeline for all 12 perturbation events (8,477 samples). |
evidence/q4-replica-inventory-snapshot-20260613055031.tsv | Committed (PII-scrubbed) | Q4 audit early-supplemental snapshot taken ~4 minutes into the supplemental run, after restart event 1 (3,662 samples, 99.08% Running). |
evidence/q5-falsification-3-consecutive-bad-buckets-20260613071722.tsv | Committed (PII-scrubbed) | Q5 falsification verdict for baseline RUN_ID, control-bucket scaffold applied — empty ([]) = H0 held under tested conditions. |
evidence/q5-falsification-3-consecutive-bad-buckets-20260613071833.tsv | Committed (PII-scrubbed) | Q5 falsification verdict for perturbation RUN_ID, control-bucket scaffold applied — empty ([]) = H0 held under tested conditions. |
evidence/q6-baseline-vs-perturb-vs-supplemental-20260613055031.tsv | Committed (PII-scrubbed) | Q6 phase-level comparison — historical, pre-scaffold, non-authoritative early-supplemental snapshot captured after restart event 1. Superseded by ...072623.tsv (control-bucket scaffold applied per Section 2 constraint #7). |
evidence/q7-system-events-timeline-20260613055431.tsv | Committed (PII-scrubbed) | Q7 rollout milestones (early-supplemental snapshot taken ~8 minutes into the supplemental run, 150 events, 18 h lookback). |
evidence/perturbation-002.log | Committed (PII-scrubbed) | Per-event PerturbationSubmitted log lines (run 002; run 001 was discarded — collected before the audit/perturbation-sampler IMDS-vs-IDENTITY_ENDPOINT bug was fixed in commit 176aeec). |
Supplemental-phase evidence
| Artifact | Status | Purpose |
|---|---|---|
evidence/supplemental-restart-001.log | Committed (PII-scrubbed) | Per-event restart log lines for the 3-event supplemental phase. |
evidence/q1-per-run-summary-20260613062708.tsv | Committed (PII-scrubbed) | Q1 result for supplemental-restart RUN_ID (289,932 reqs, 1 err, 0.000345% overall). |
evidence/q2-buckets-10s-sum-vus-20260613071909.tsv | Committed (PII-scrubbed) | Q2 result for supplemental-restart RUN_ID, control-bucket scaffold applied (186 buckets, single error at 2026-06-13T05:59:00Z bucket = 0.062%). |
evidence/q3-revision-state-timeline-20260613062708.tsv | Committed (PII-scrubbed) | Q3 sampler timeline including all 3 supplemental restart events. |
evidence/q4-replica-inventory-snapshot-20260613062708.tsv | Committed (PII-scrubbed) | Q4 final audit snapshot (3,805 samples, 99.03% Running, ~15.6 h window). |
evidence/q5-falsification-3-consecutive-bad-buckets-20260613071920.tsv | Committed (PII-scrubbed) | Q5 falsification verdict for supplemental RUN_ID, control-bucket scaffold applied — empty ([]) = no falsification windows under H0. |
evidence/q6-baseline-vs-perturb-vs-supplemental-20260613072623.tsv | Committed (PII-scrubbed) | Q6 phase-level comparison, control-bucket scaffold applied, all 4 phases (authoritative — "other" bucket count is 96 vs. 92 in the pre-scaffold 20260613062708.tsv because empty preflight bins are now counted explicitly; all four other phases unchanged). |
evidence/q7-system-events-timeline-20260613062708.tsv | Committed (PII-scrubbed) | Q7 rollout + restart milestones (168 events, 18 h lookback, post-supplemental). |
Provenance
All evidence files are scrubbed by evidence/scrub-pii.sh (idempotent, re-run after each new file is added). The script's behavior is documented in its 25-line header. PII rules align with scripts/portal-capture-helpers.js PII_RULES, adapted for plaintext logs.
Today's repro evidence (2026-06-20)
On 2026-06-20 the lab was re-run end-to-end against a freshly-provisioned resource group rg-aca-startup-degraded (env cae-sdlab-j2fs74, suffix j2fs74) to validate that the H0-held verdict still holds under the current toolchain, and to capture the Portal-level evidence catalogued in the next subsection. The repro produced its own raw evidence pack (qA-qG), preserved alongside the original lab exports:
| Artifact | Rows | Purpose |
|---|---|---|
evidence/qA-revision-state-20260620T223951Z.json | 862 | RevisionStateSample 5s cadence covering all 3 perturbation events (rollout-event-1 through rollout-event-3), parsed from ContainerAppConsoleLogs_CL where ContainerName_s == "sampler". |
evidence/qB-replica-inventory-20260620T223955Z.json | 342 | ReplicaInventorySample 30s cadence, parsed from ContainerAppConsoleLogs_CL where ContainerName_s == "audit". Captures all 4 revisions (bhly9qa, 0000001, 0000002, 0000003) × Running/NotRunning summary. |
evidence/qC-k6-buckets-20260620T224056Z.json | 126 | k6 10-second bucket aggregate (sum across VUs) from ContainerAppConsoleLogs_CL where ContainerName_s == "k6". All 126 buckets show err_total == 0 across baseline + all 3 perturbation events — the falsification rule did not fire. |
evidence/qD-system-events-20260620T224002Z.json | 51 | System event Reason/Type/Revision breakdown from ContainerAppSystemLogs_CL, confirming all 3 rolling rollouts completed cleanly. |
evidence/qE-perturbation-markers-20260620T224143Z.json | 6 | PerturbationWindowMarker start/end pairs for the 3 sampler runs, parsed from ContainerAppConsoleLogs_CL where ContainerName_s == "sampler" AND kind == "PerturbationWindowMarker". Overlapping windows (each sampler is 600s, fired every 300s) confirm the per-event procedure executed as designed. |
evidence/qF-run-summary-20260620T224149Z.json | 2 | Per-run falsification verdict (one row per run_id: baseline-20260620213447, perturbation-20260620220432). Both rows: falsified == false. |
evidence/qG-audit-sampler-quirk-20260620T225143Z.json | — | Documentation of the audit-sampler "Failed" status quirk — see Known issues subsection below. |
Per-run verdict (this repro):
run_id | OK | Err | Buckets | worst_bucket_err_pct | falsified |
|---|---|---|---|---|---|
baseline-20260620213447 | 47,506 | 0 | 9,637 (per-VU) | 0.000% | false |
perturbation-20260620220432 | 149,699 | 0 | 36,069 (per-VU) | 0.000% | false |
The 2026-06-20 repro reaches the same verdict as the original lab run — H0 held — with a smaller event count (3 vs 12) but the same falsification rule and the same KQL methodology. The repro adds Portal-level evidence (next subsection) that the original lab run did not collect.
Observed Evidence (Portal Captures — 2026-06-20)
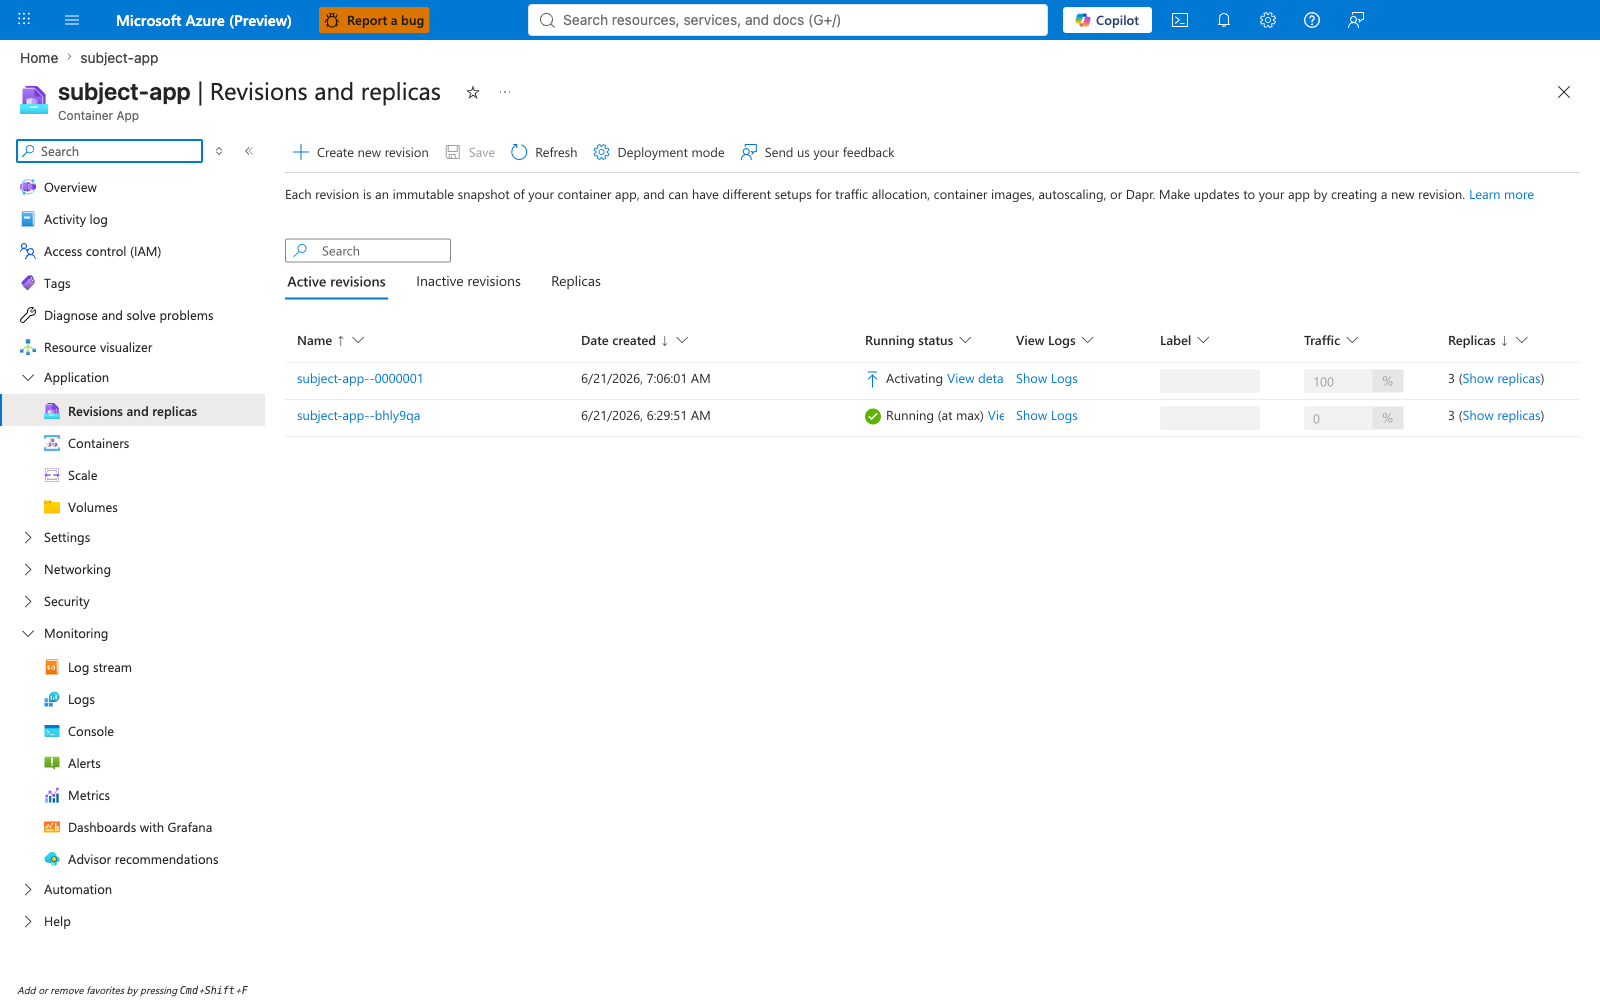
Reproduced in rg-aca-startup-degraded / cae-sdlab-j2fs74, koreacentral, Consumption profile inside a zone-redundant environment. Subject app: subject-app, 3 replicas (min=max=3), STARTUP_DELAY_SECONDS=25, dedicated /healthz probe path. Initial revision subject-app--bhly9qa; 3 perturbation events promoted revisions 0000001 → 0000002 → 0000003 (the final active revision at capture time). The captures below document the lab end-to-end: baseline state → 3 perturbation events → post-experiment LAW queries → companion job lifecycles. The Resource Group Overview and Container Apps Environment Overview baseline views are described as structured prose plus az CLI commands instead of Portal screenshots, since the original captures of those two blades did not render correctly.
The captures are grouped into clusters. Each cluster opens with the operator question it answers; individual captures carry the [Observed] / [Strongly Suggested] / [Inferred] evidence tag that matches Section 12's evidence-level taxonomy.
Baseline (captures 01-18)
[Observed] Pre-perturbation baseline state — the lab infrastructure provisioned, the subject app running at min=max=3 replicas on the initial revision subject-app--bhly9qa, and the loadgen-k6 job's baseline-20260620213447 run completing successfully.
Resource Group rg-aca-startup-degraded (region koreacentral) provisions the lab's networking, Log Analytics workspace, user-assigned managed identity, the Container Apps Environment, the subject Container App, and the three companion Container Apps Jobs. The exact resource list is defined in labs/startup-degraded-transient-failure/infra/main.bicep and can be re-listed live with:
az resource list --resource-group rg-aca-startup-degraded \
  --query "[].{name:name, type:type}" \
  --output table
| Command | Why it is used |
|---|---|
az resource list --resource-group rg-aca-startup-degraded --query "[].{name:name, type:type}" --output table | Lists every resource the lab provisions inside rg-aca-startup-degraded so the reader can compare the live state against labs/startup-degraded-transient-failure/infra/main.bicep without opening the Resource Group blade in the Portal. |
Container Apps Environment cae-sdlab-j2fs74 uses the Workload profiles plan with the Consumption profile, runs zone-redundant inside koreacentral, and has the Log Analytics workspace log-sdlab-j2fs74 attached for ingestion:
az containerapp env show --name cae-sdlab-j2fs74 \
  --resource-group rg-aca-startup-degraded \
  --query "{location:location, zoneRedundant:properties.vnetConfiguration.zoneRedundant, workloadProfiles:properties.workloadProfiles[].{name:name, type:workloadProfileType}}" \
  --output yaml
| Command | Why it is used |
|---|---|
az containerapp env show --name cae-sdlab-j2fs74 --resource-group rg-aca-startup-degraded --query "{location, zoneRedundant, workloadProfiles[]}" --output yaml | Shows the Container Apps Environment's region, zone-redundant flag, and the workload-profile list so the reader can confirm the env runs zone-redundant on the Consumption profile — matching the lab's Bicep configuration without opening the Environment Overview blade in the Portal. |
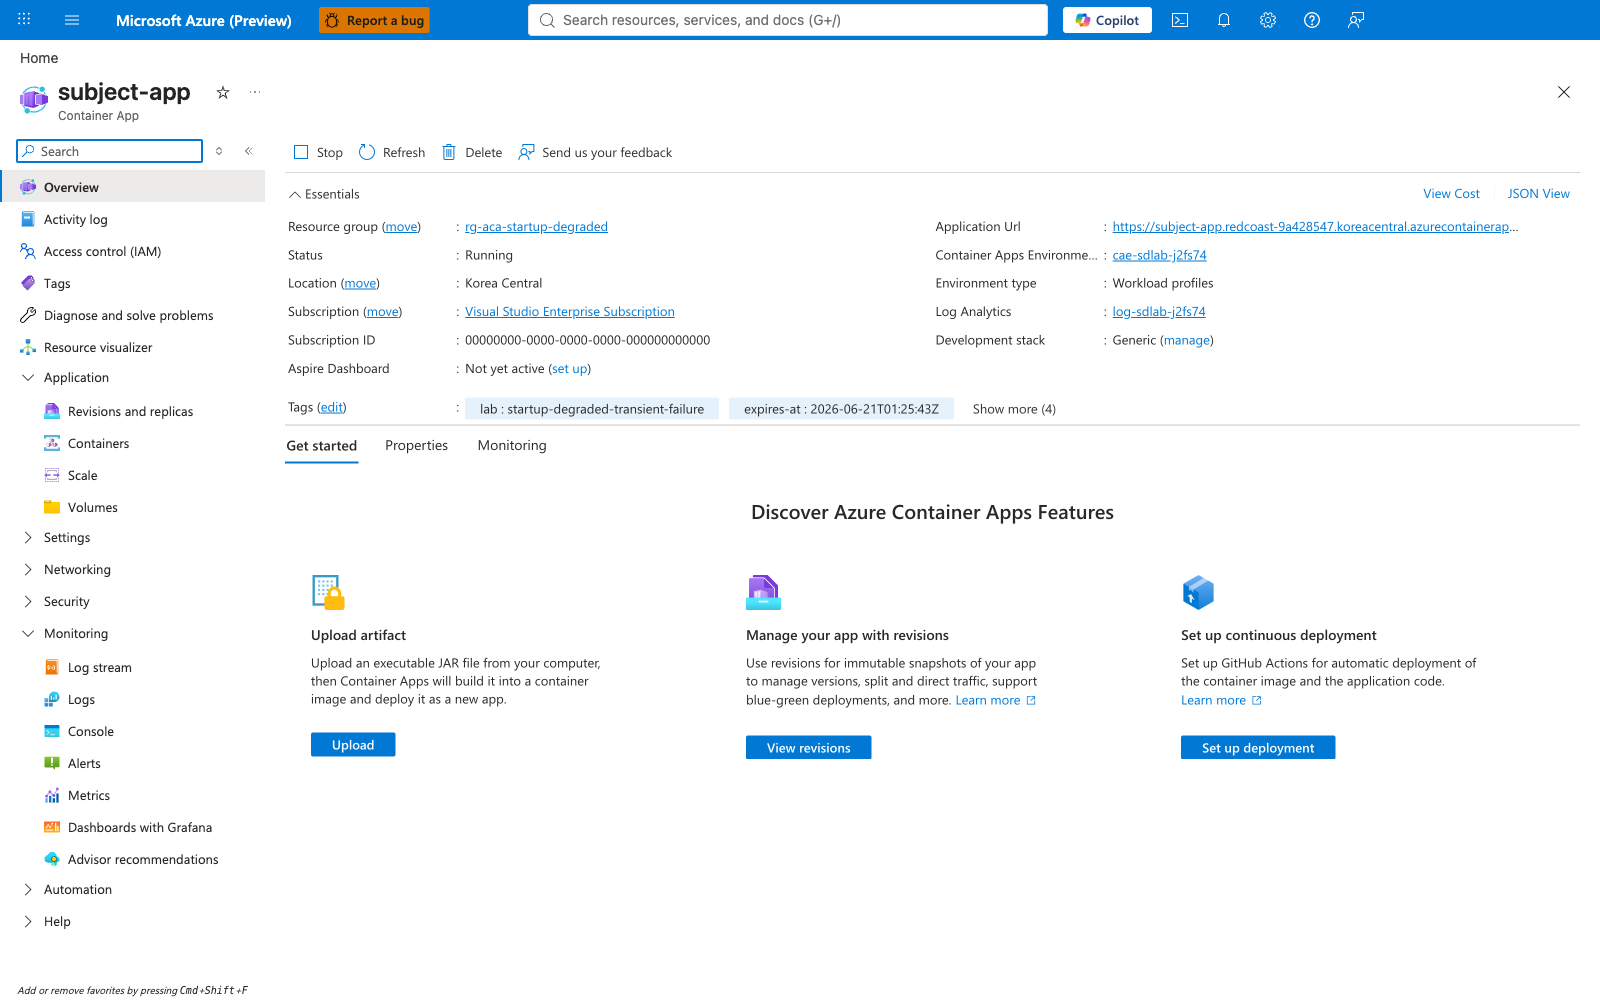
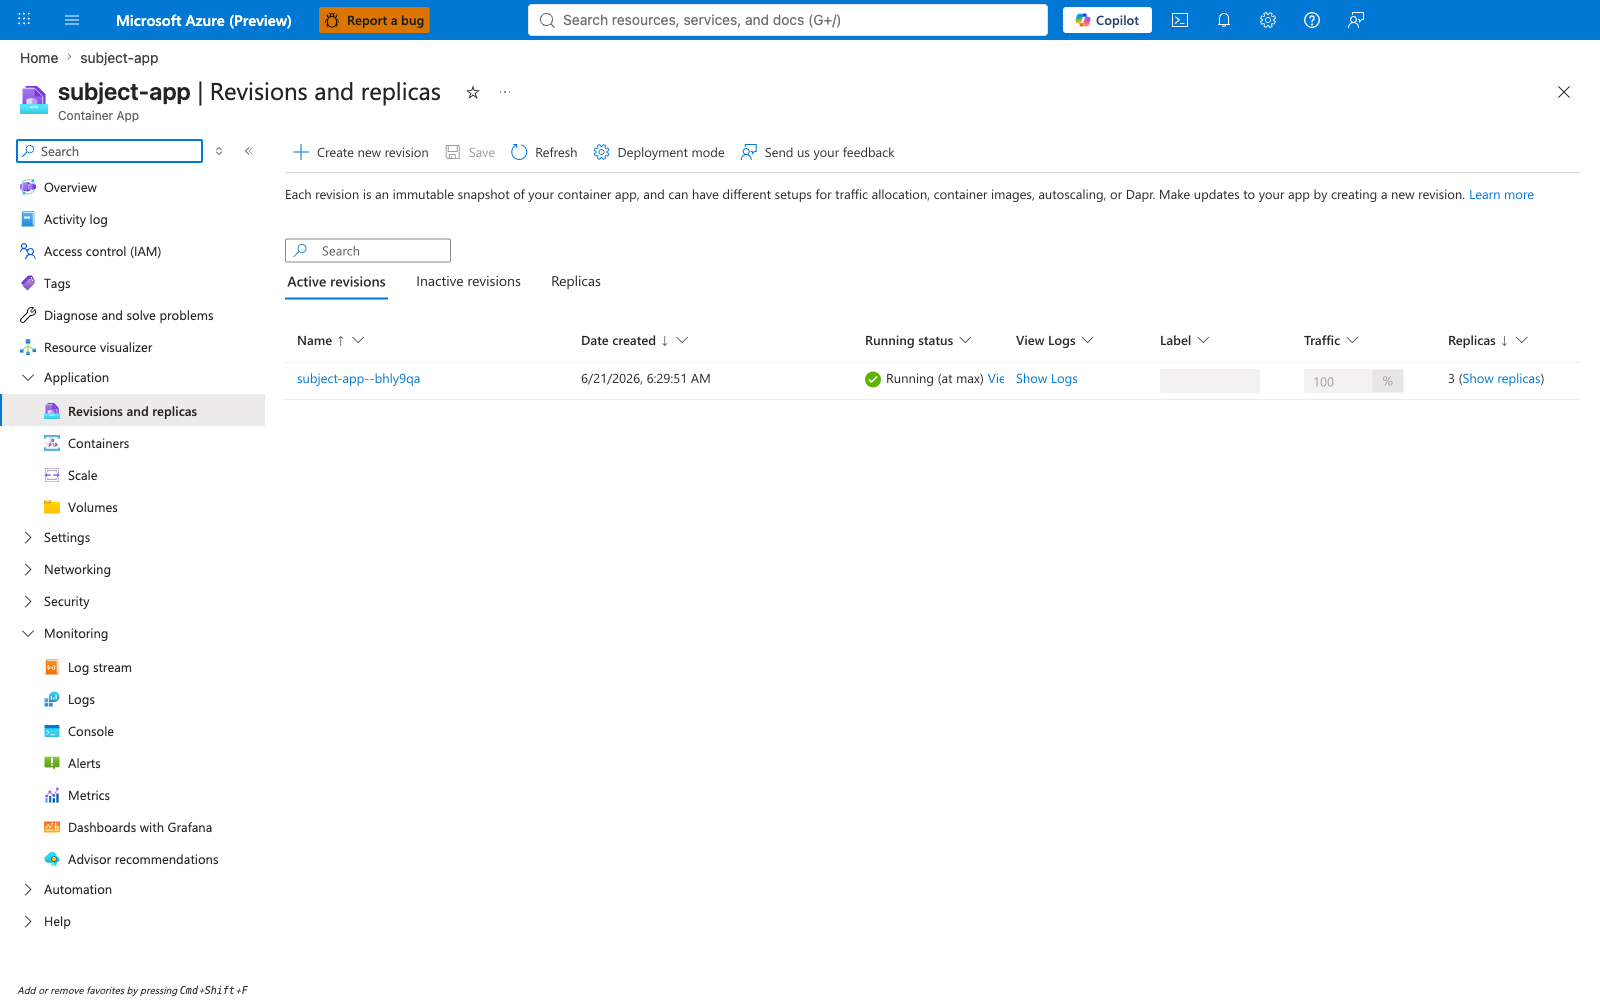
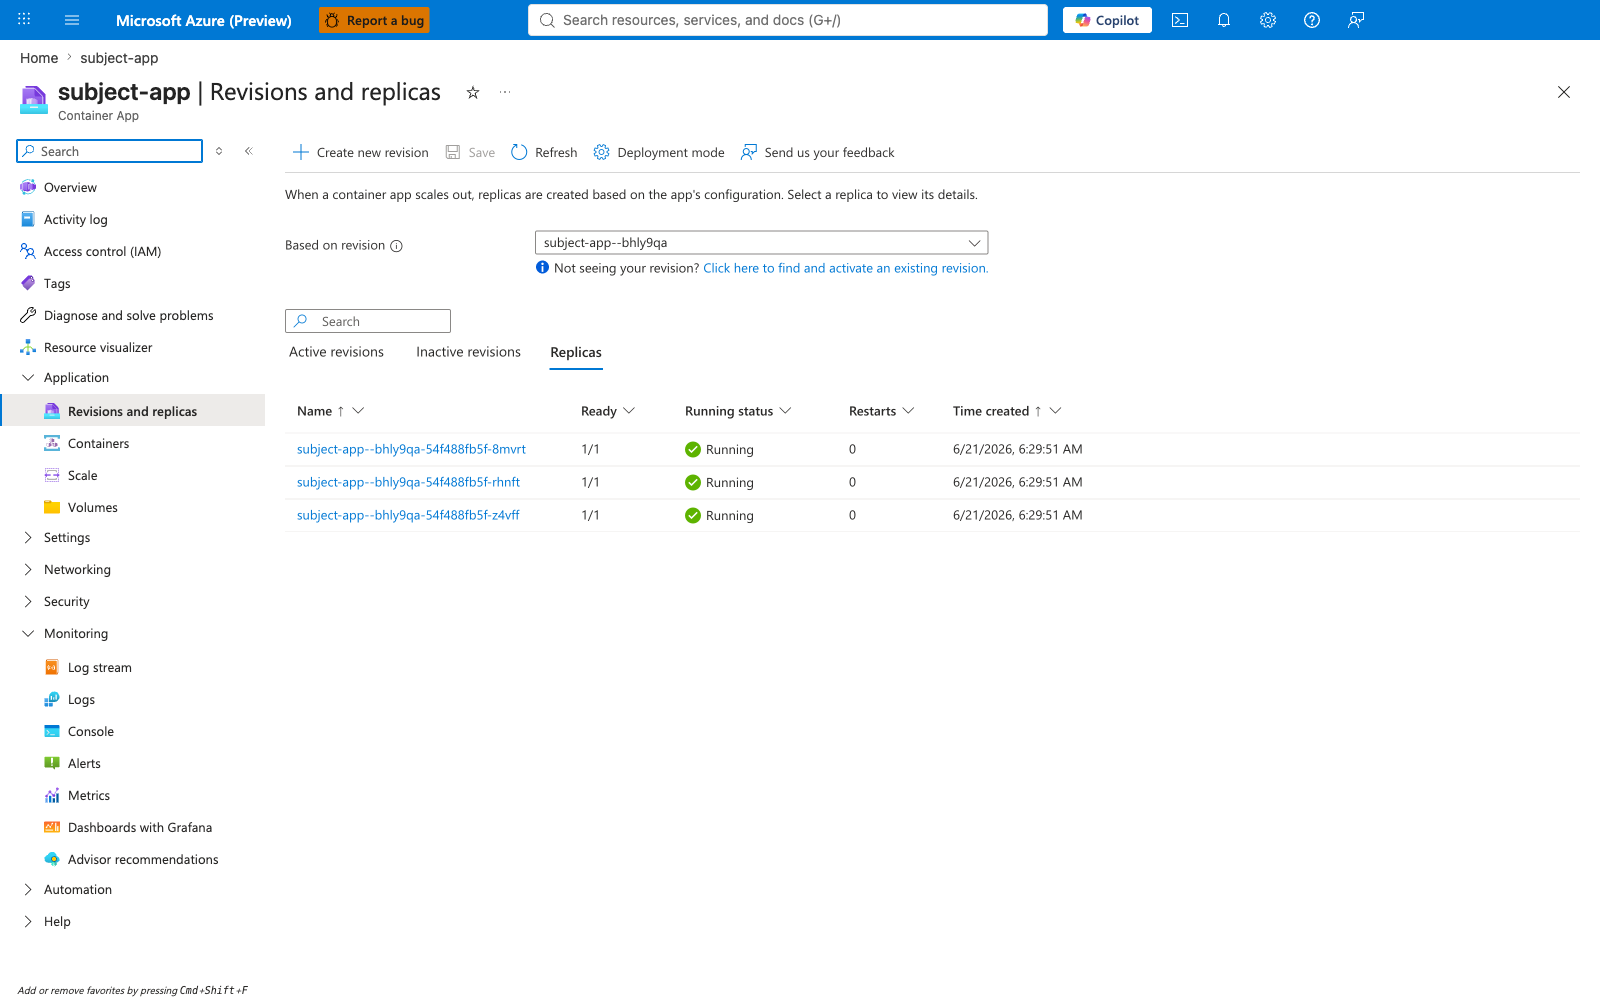
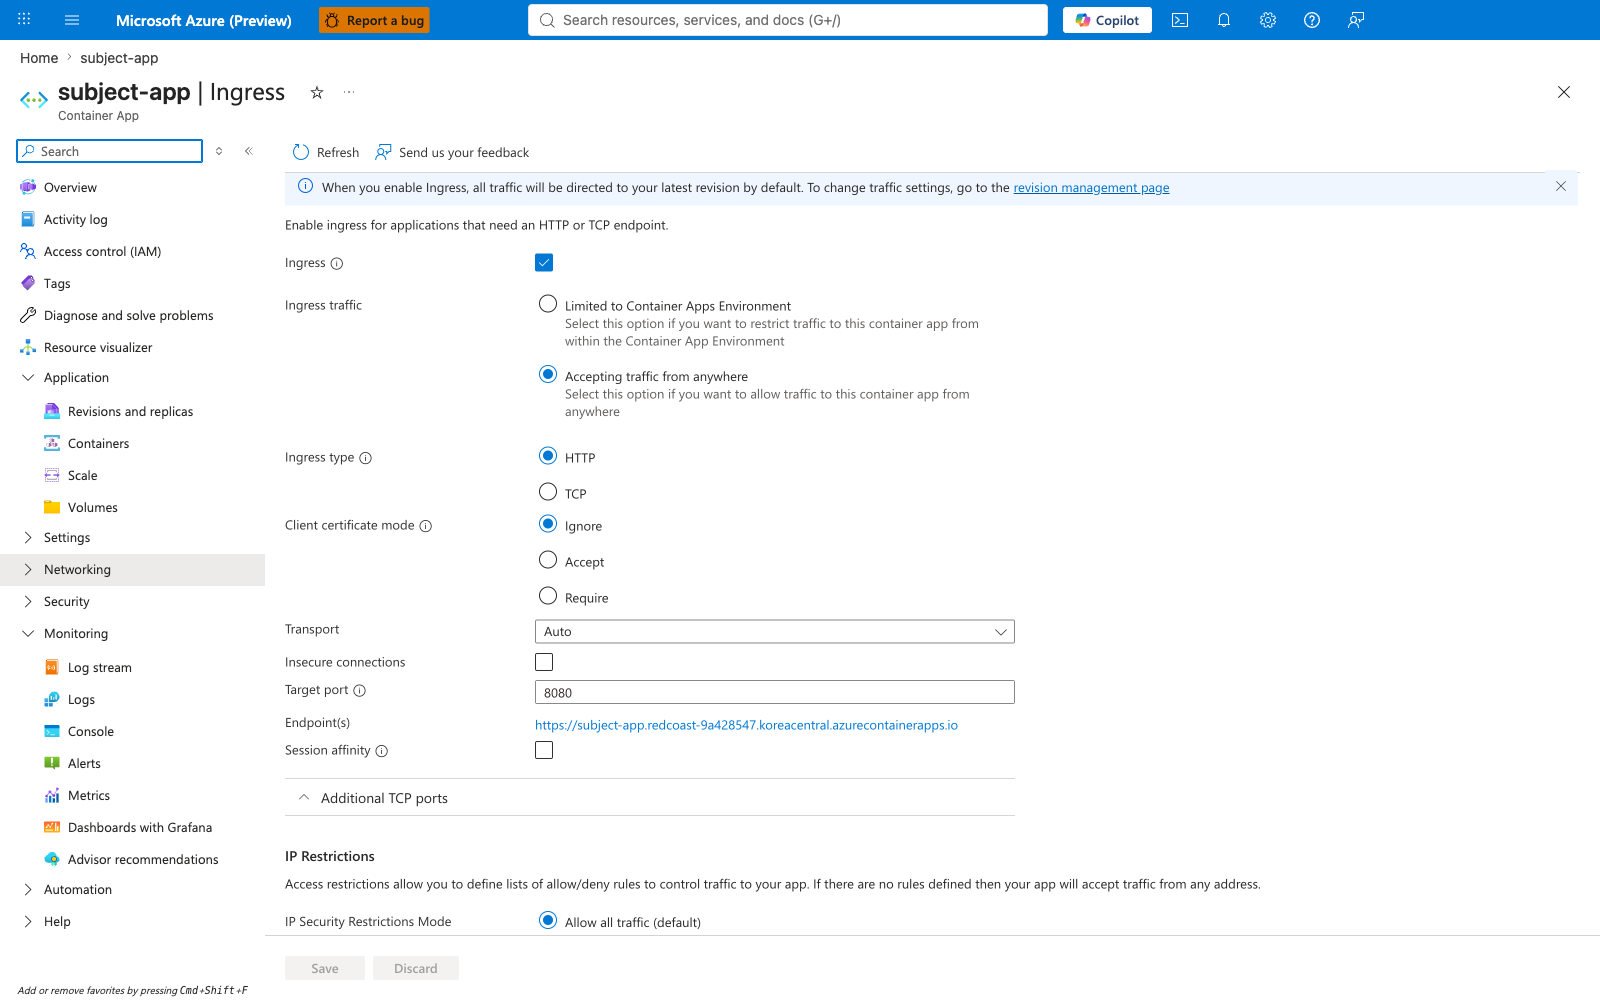
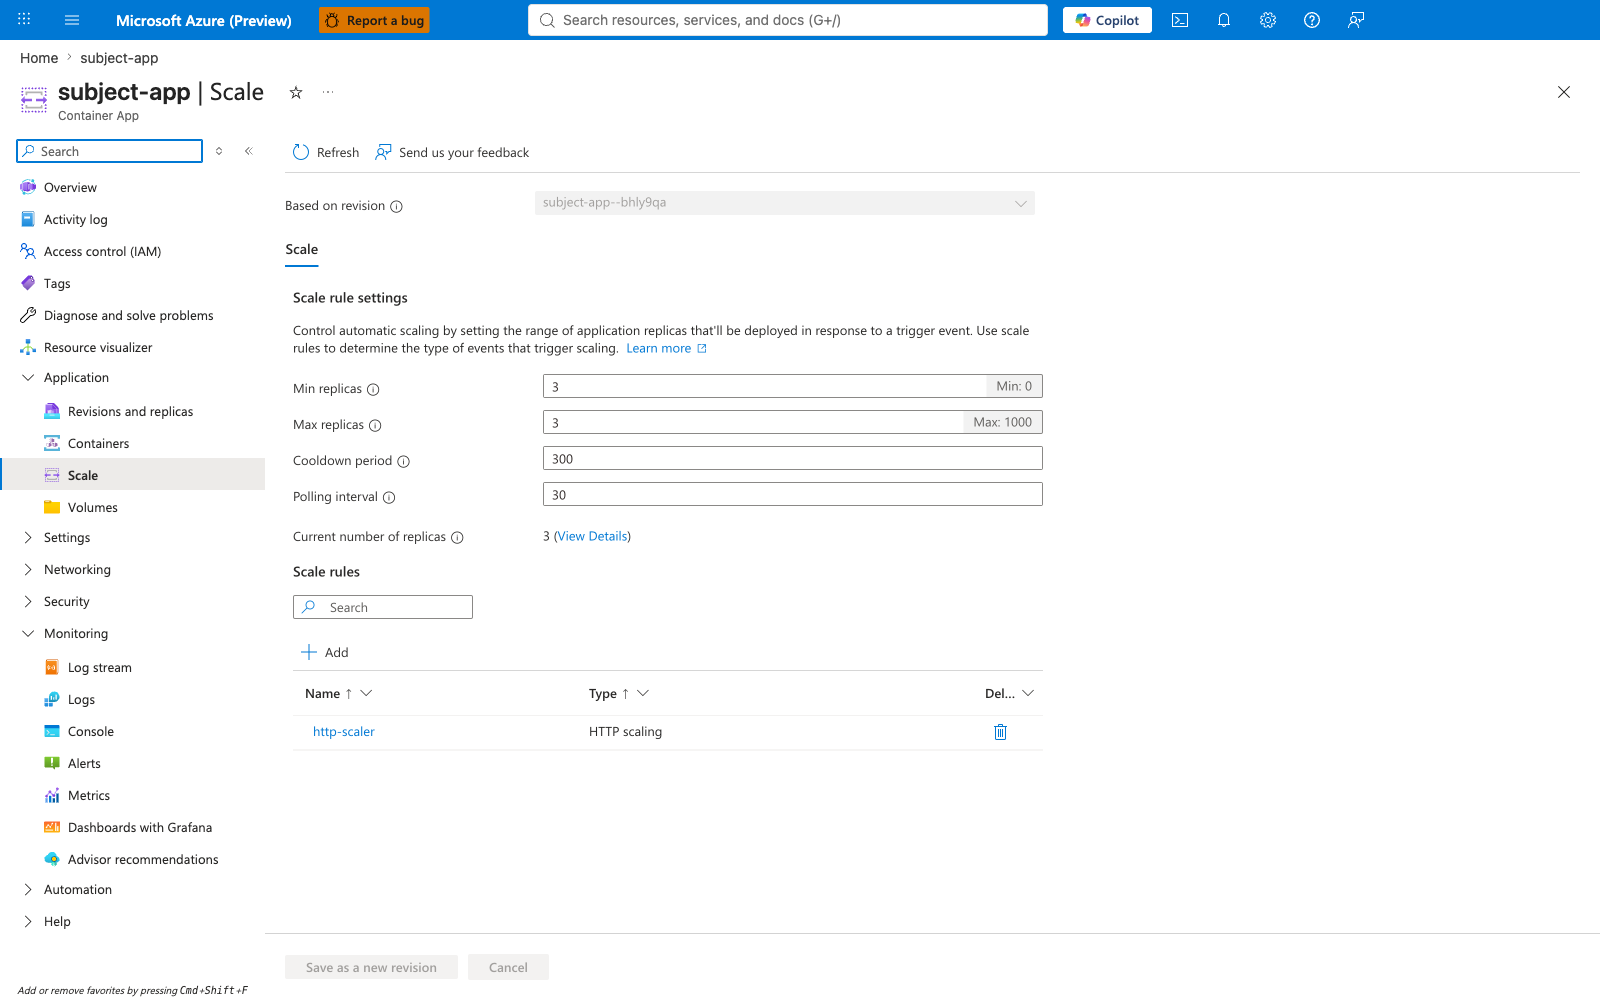
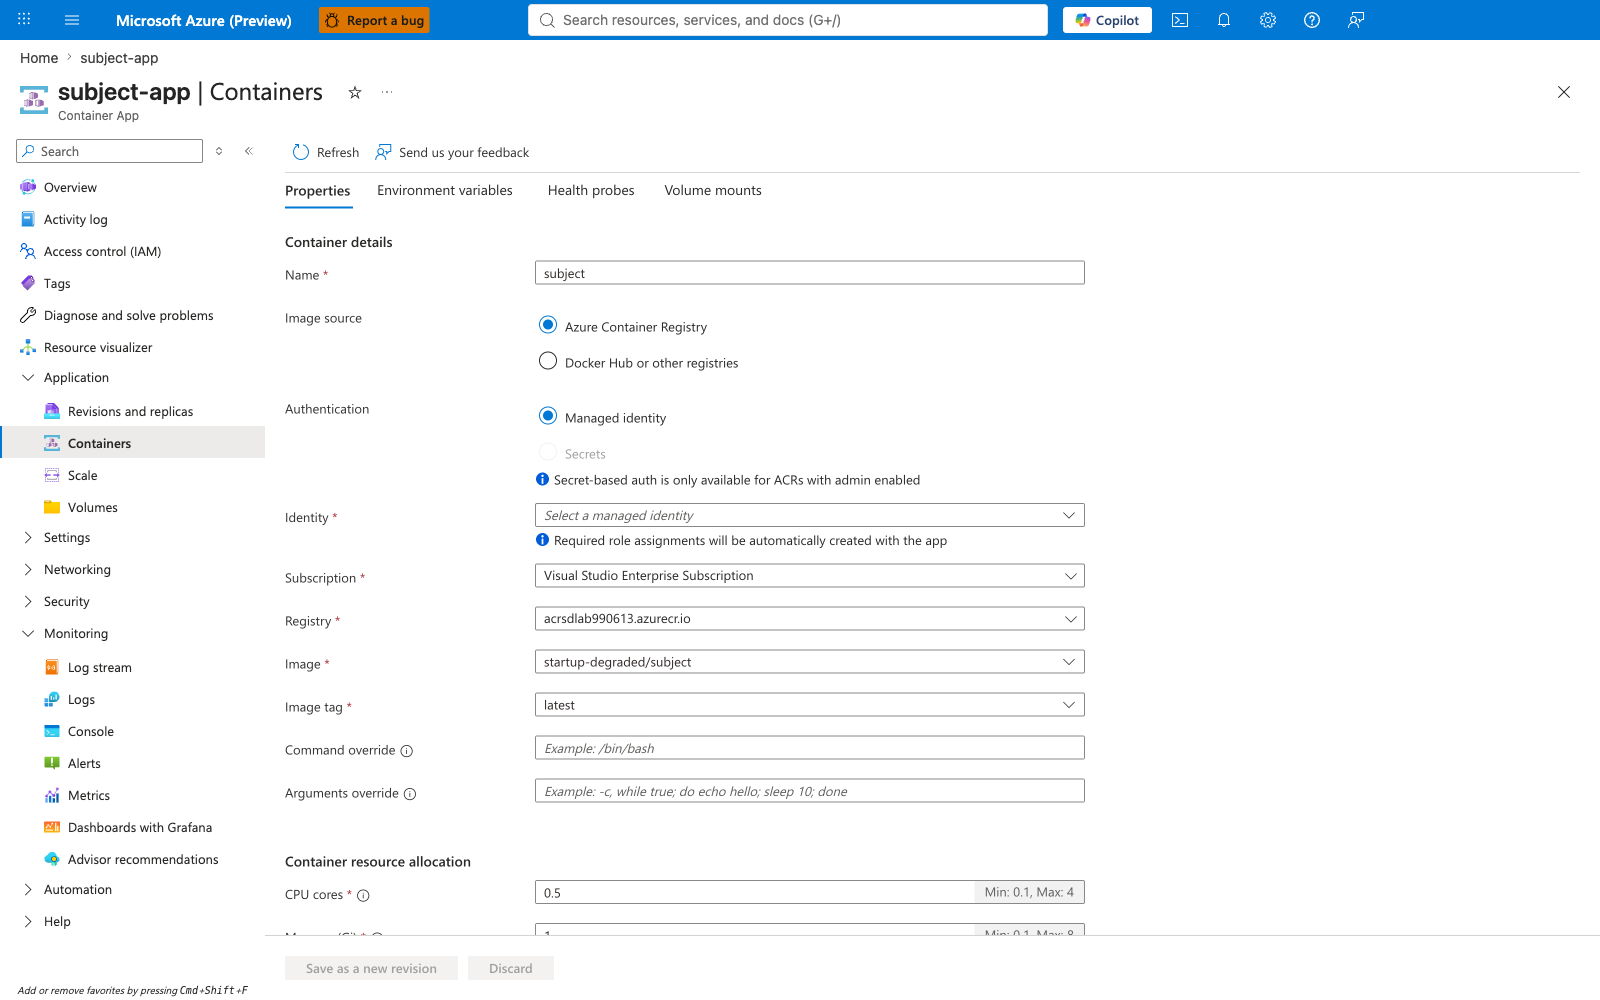
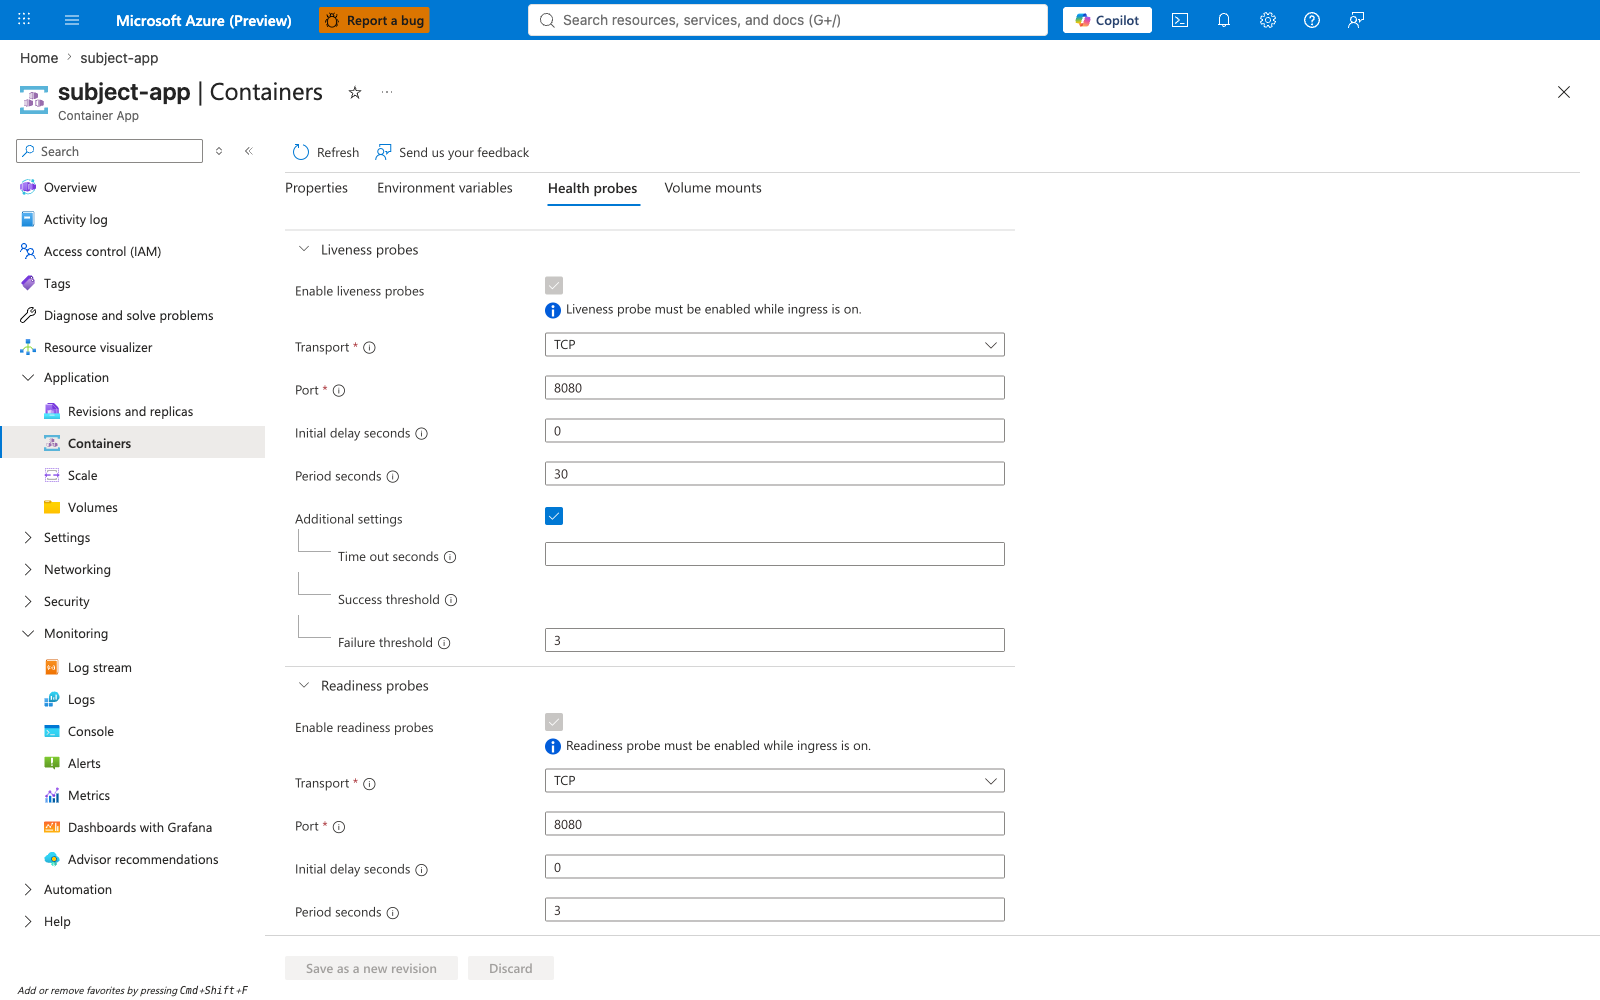
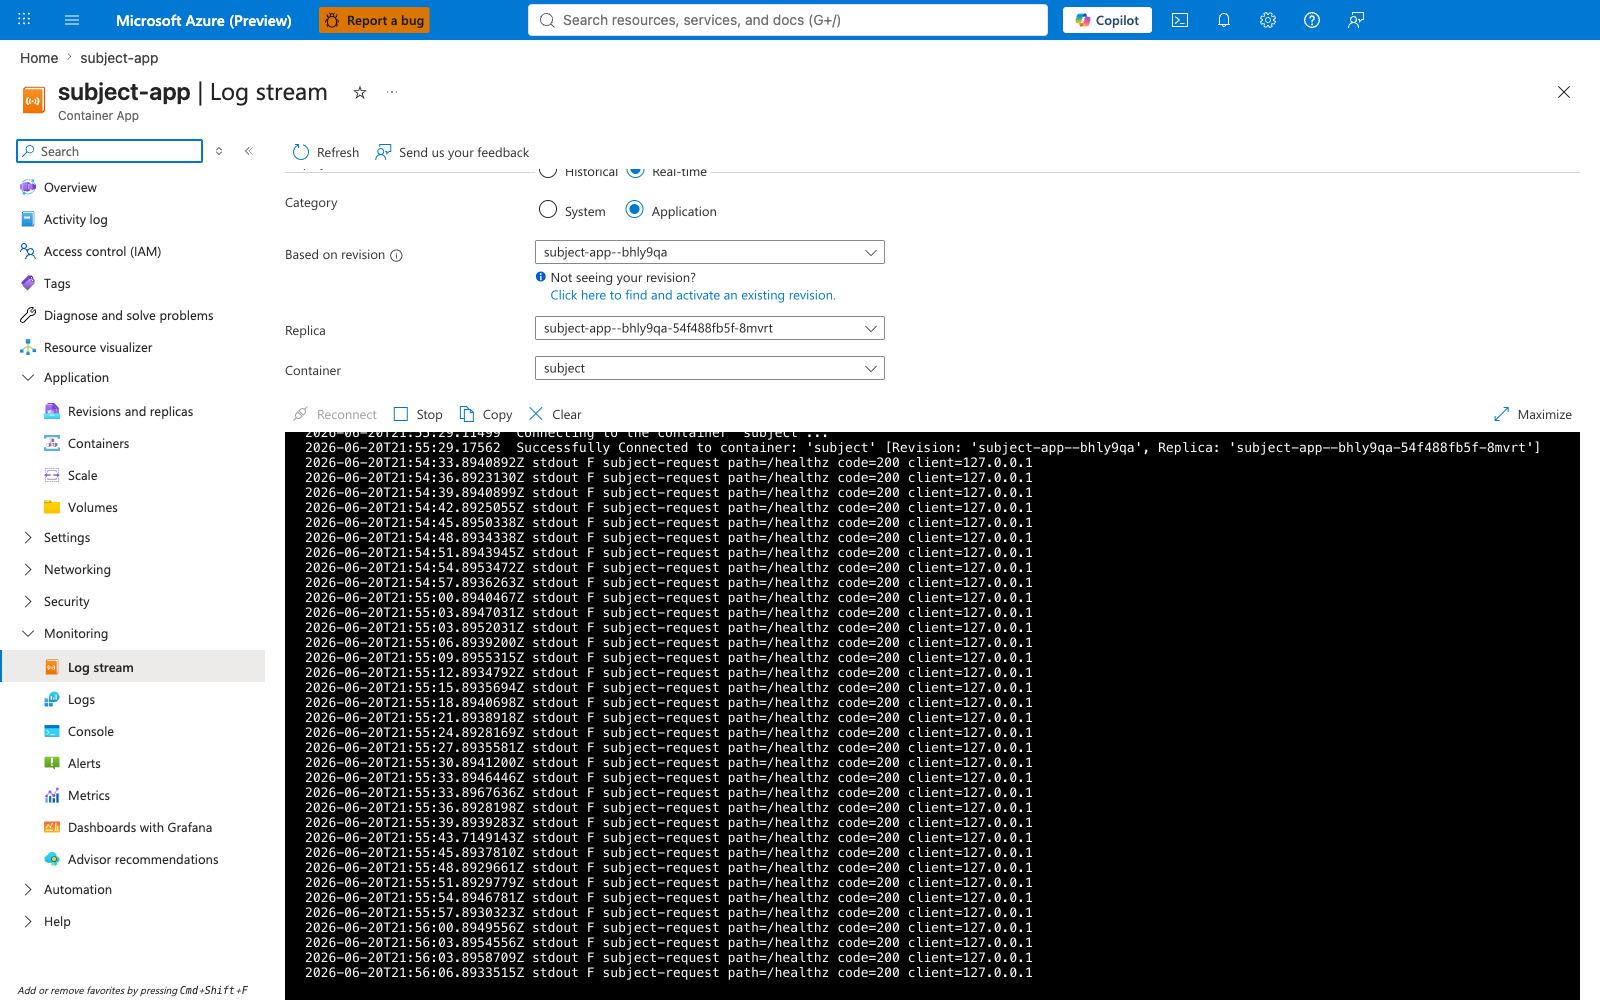
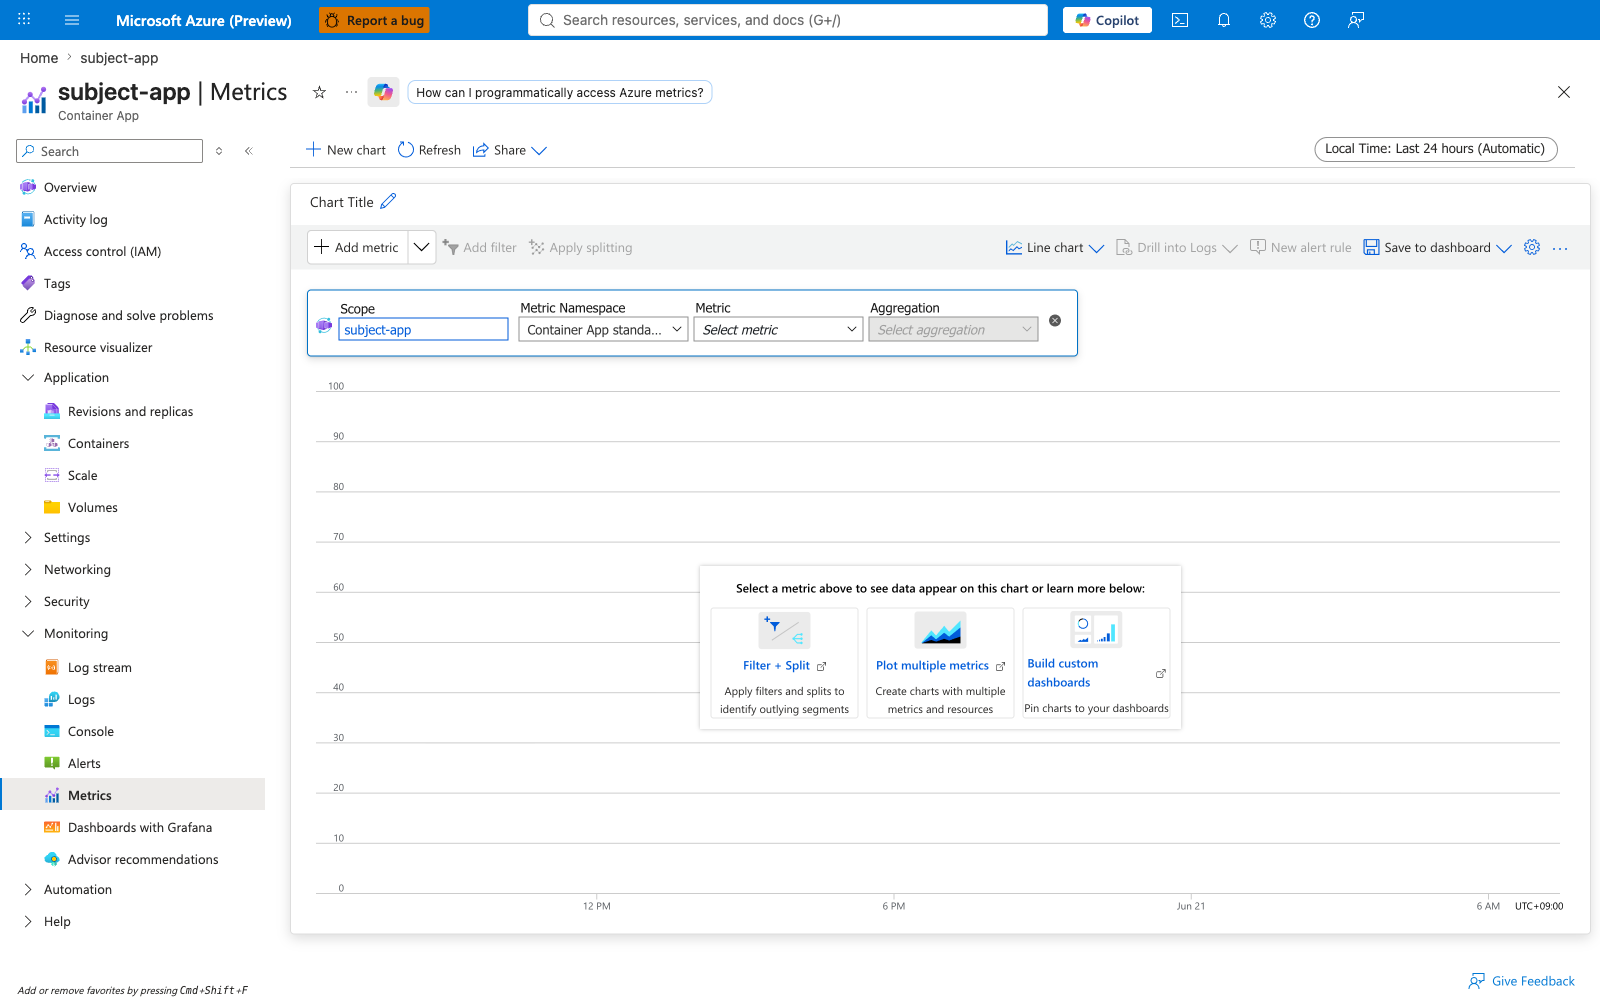
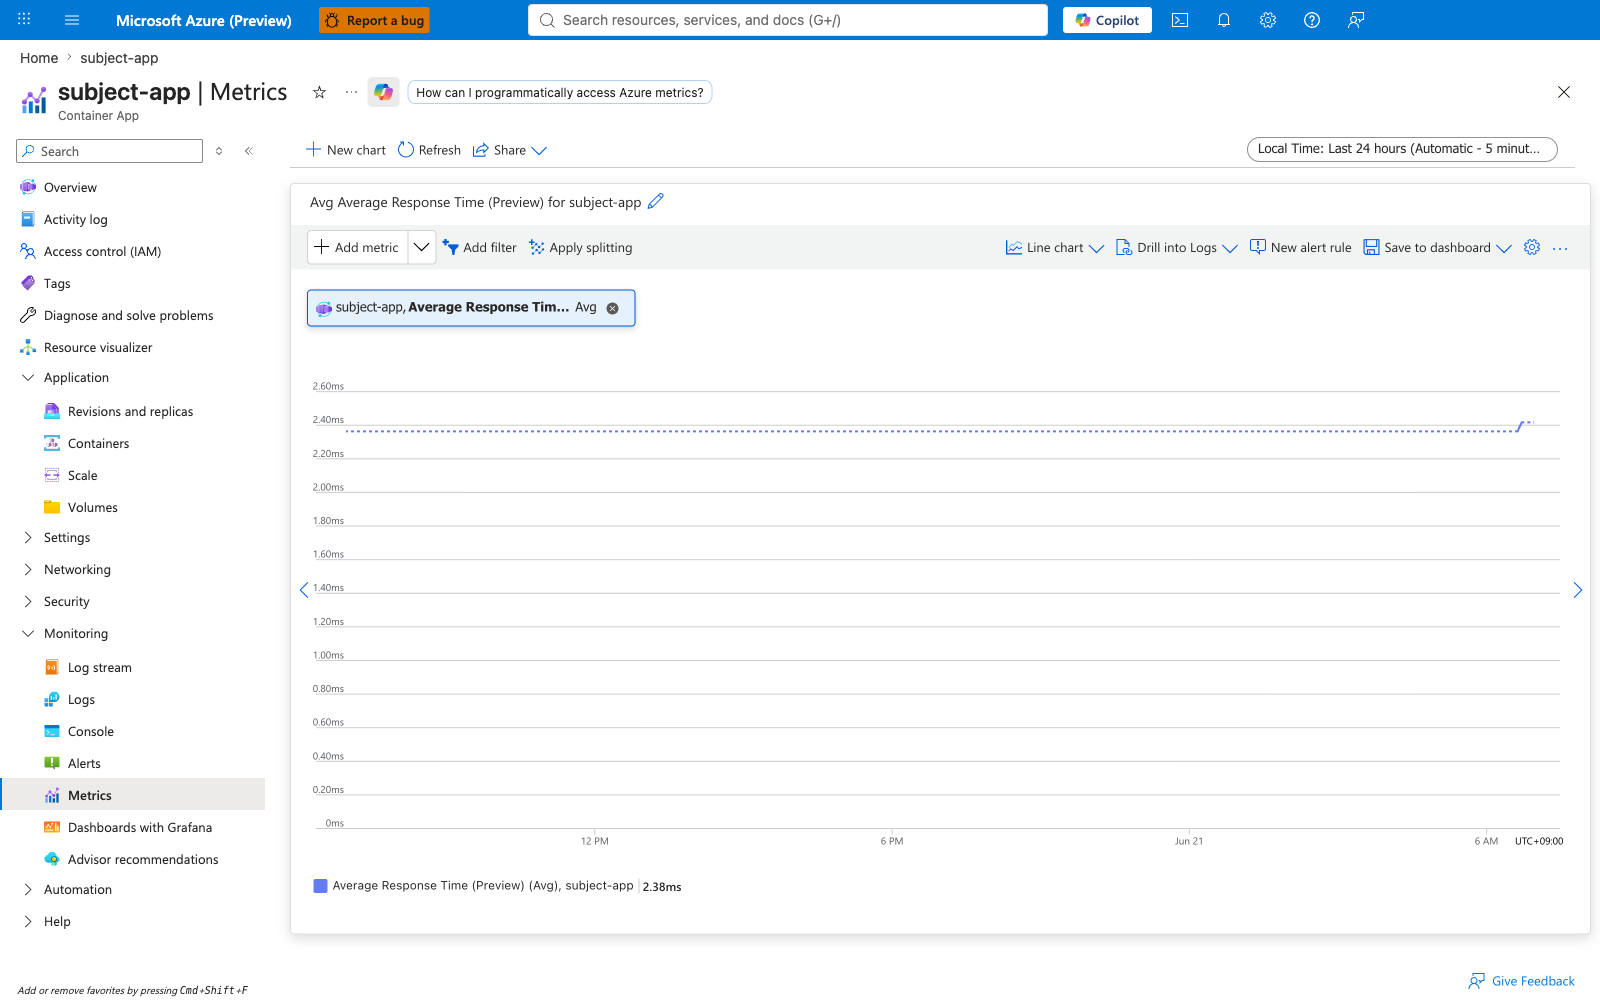
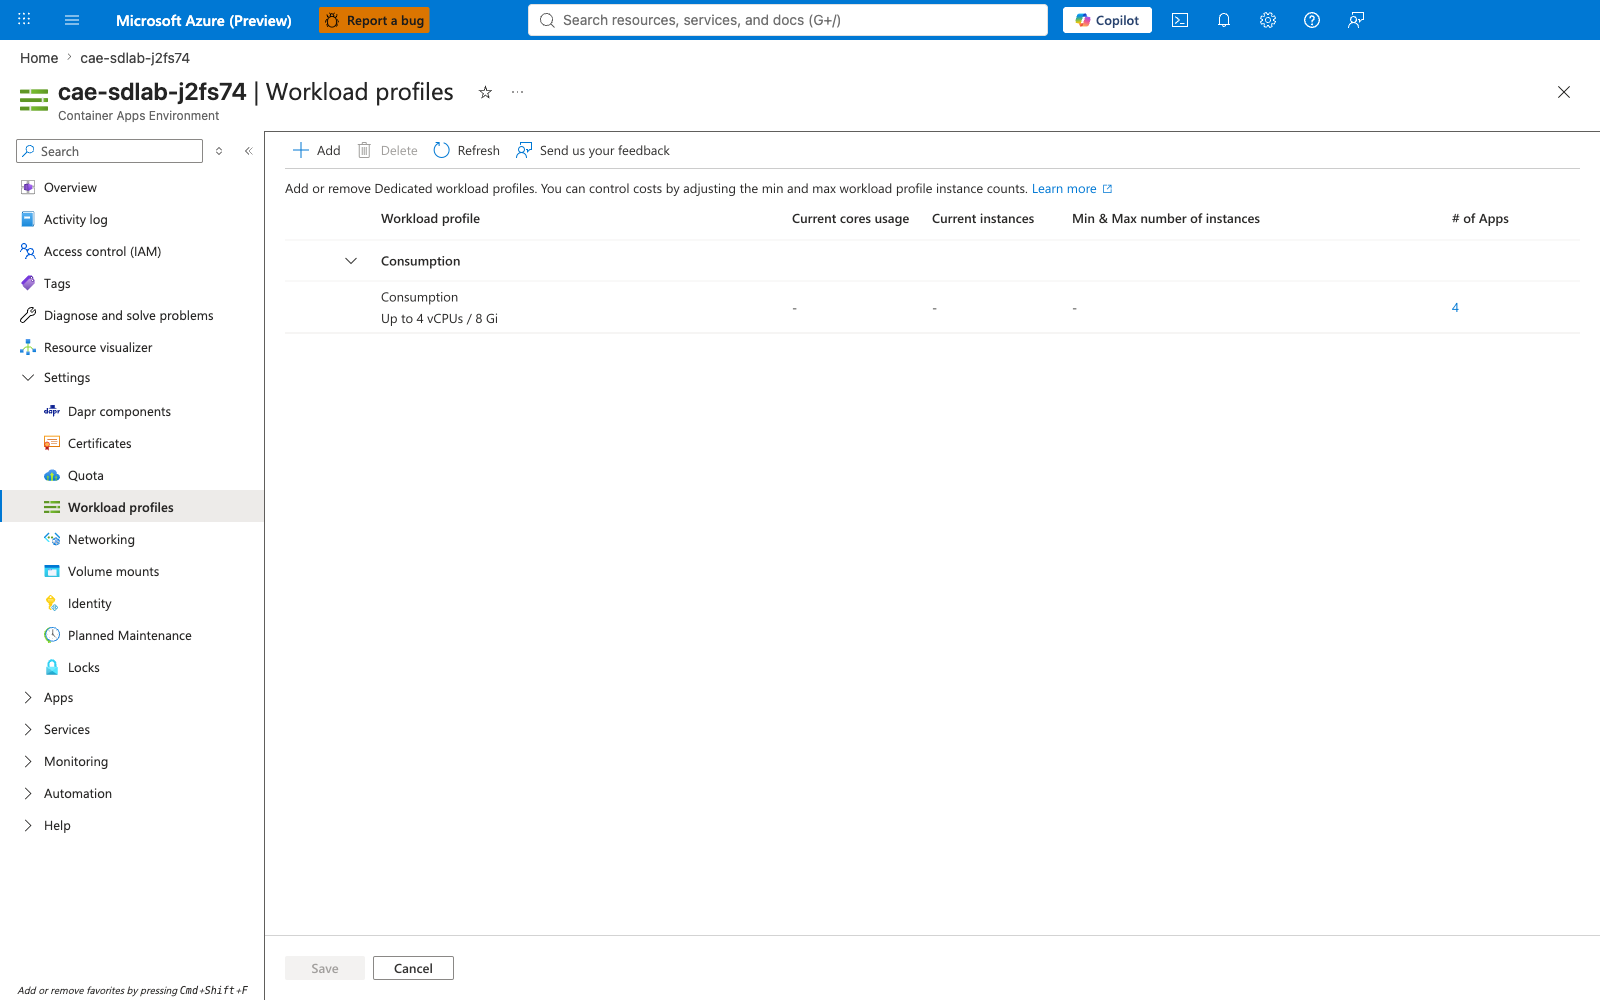
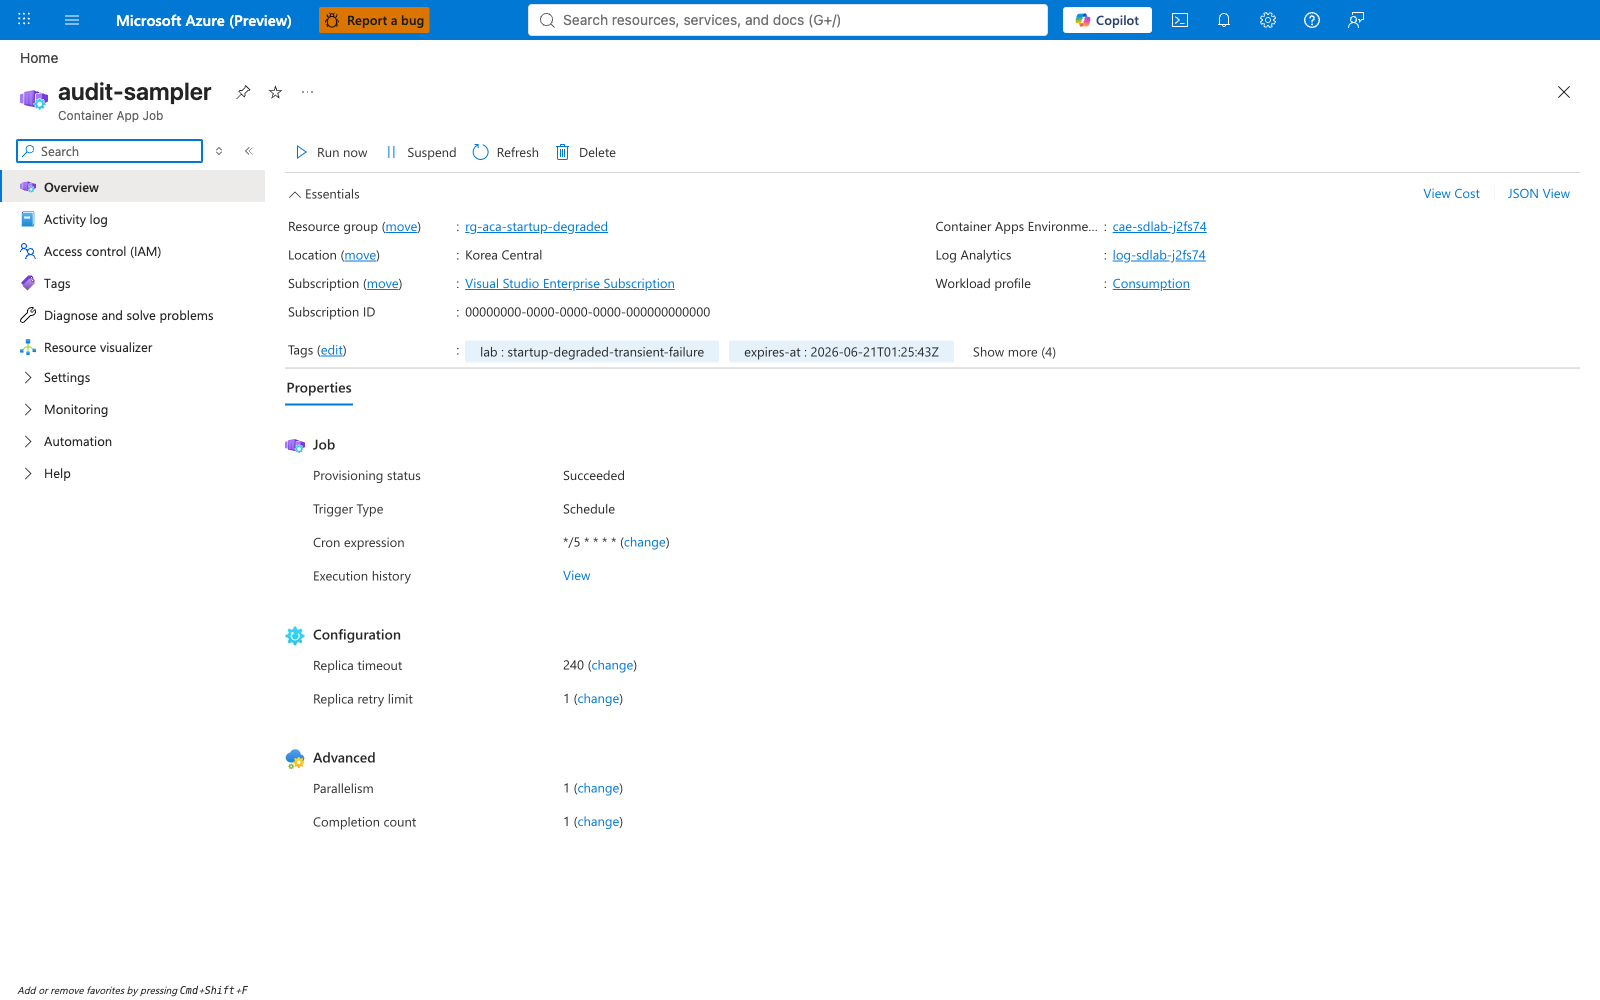
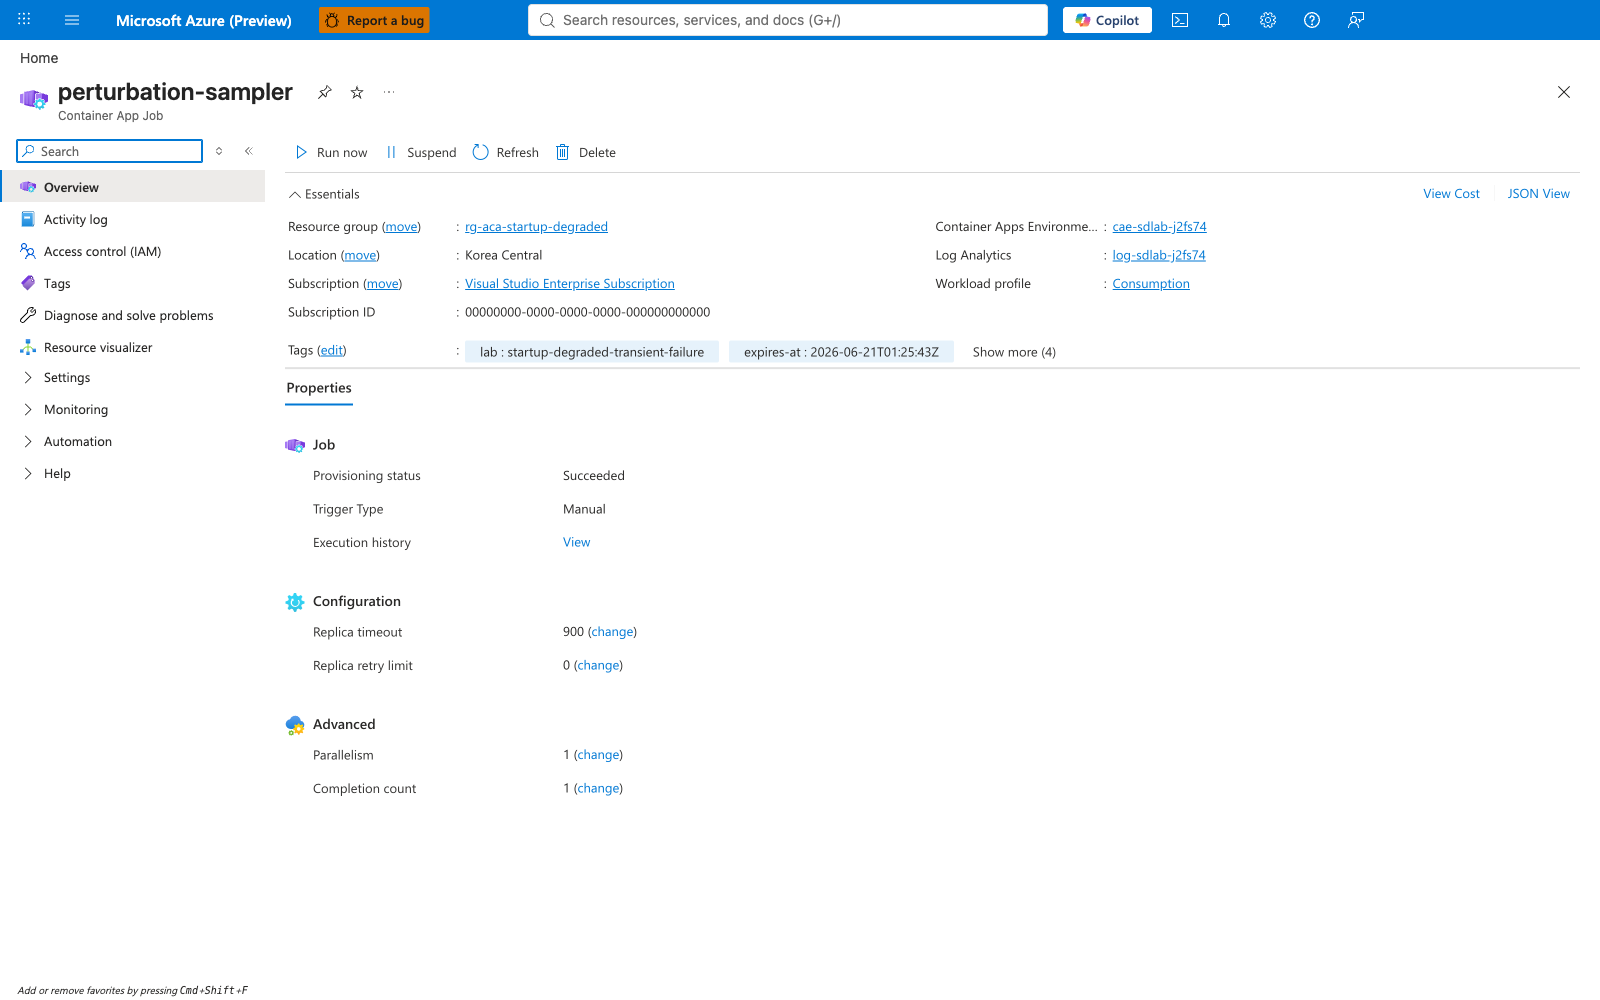
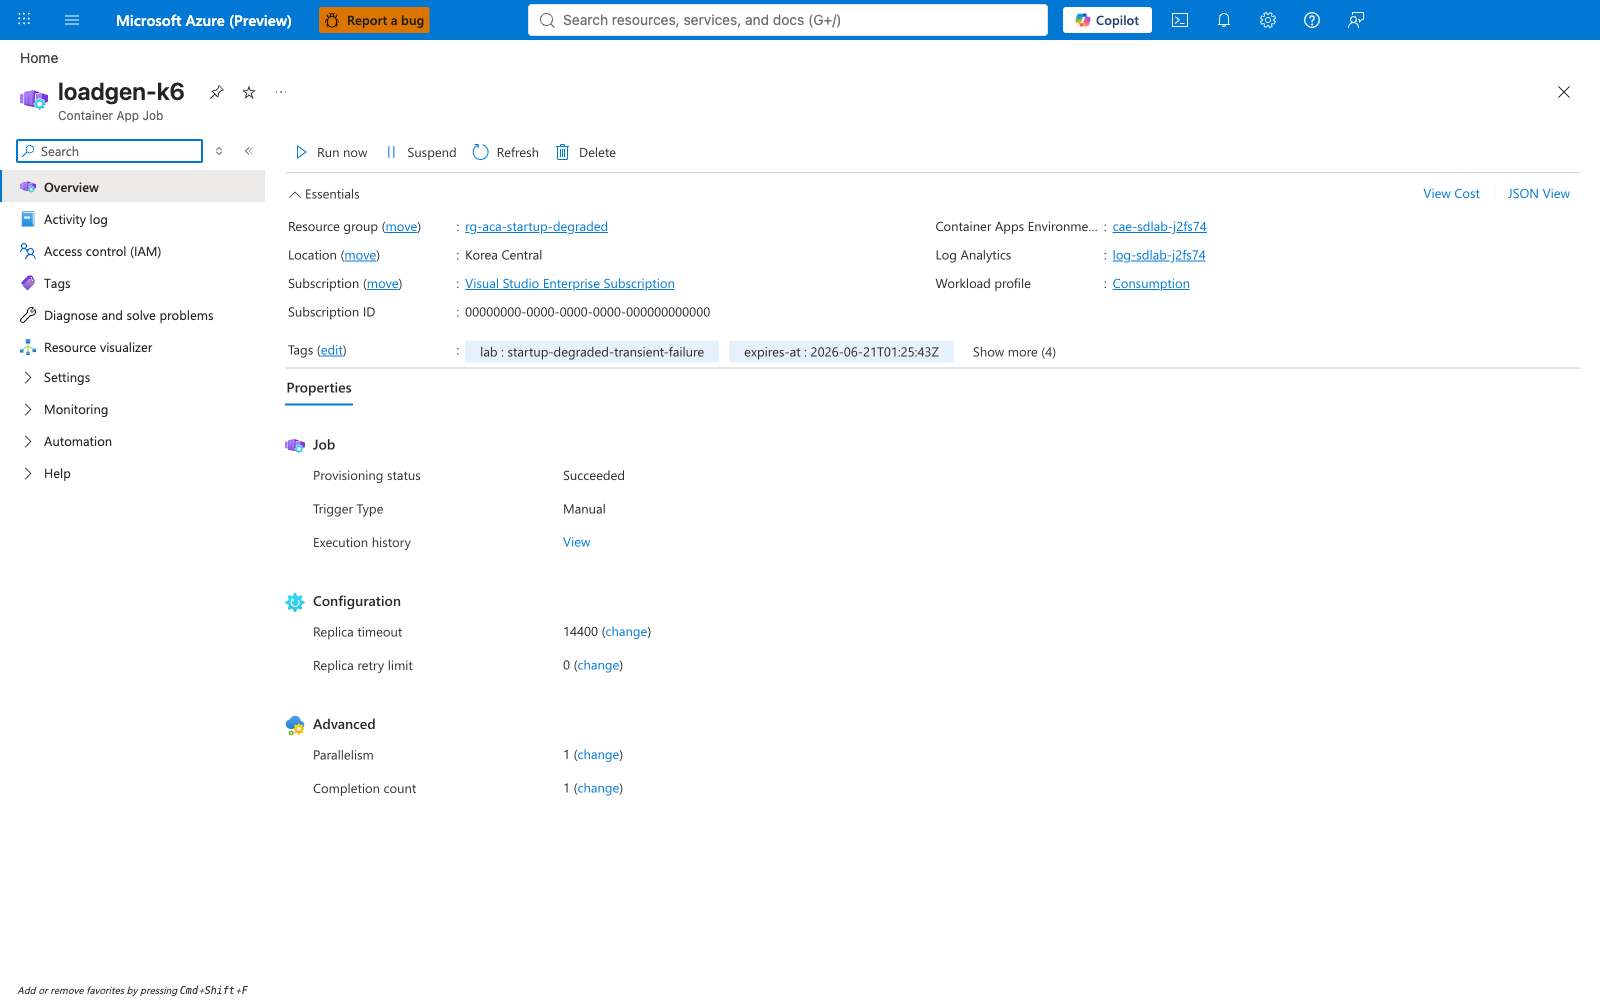
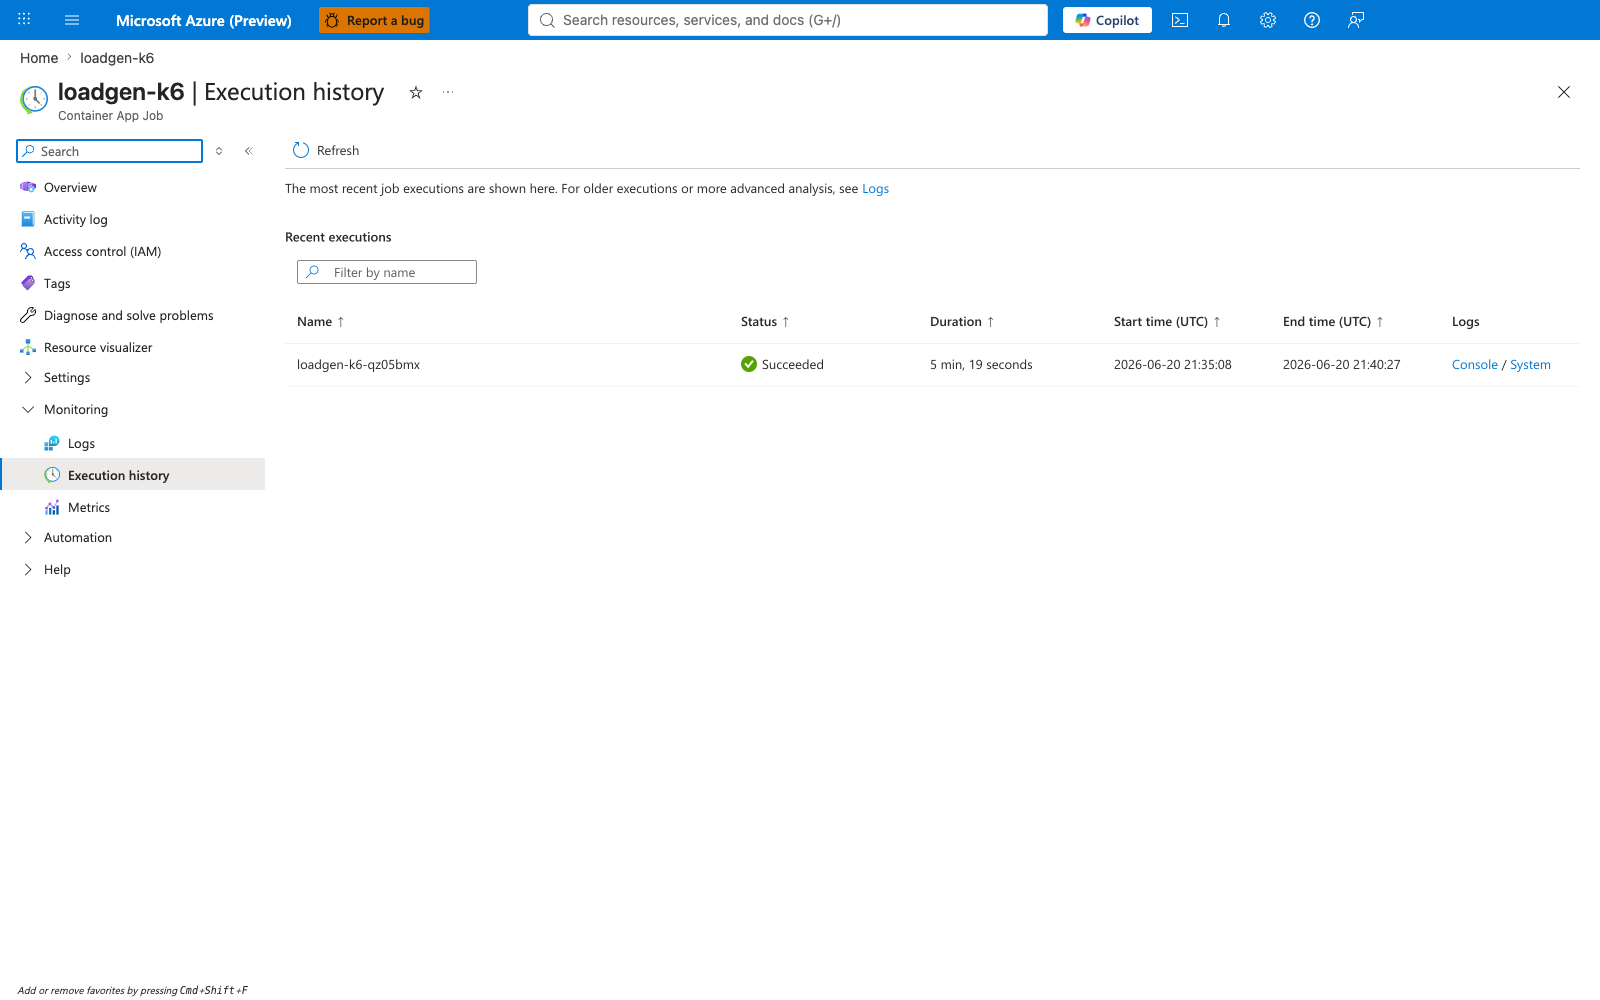
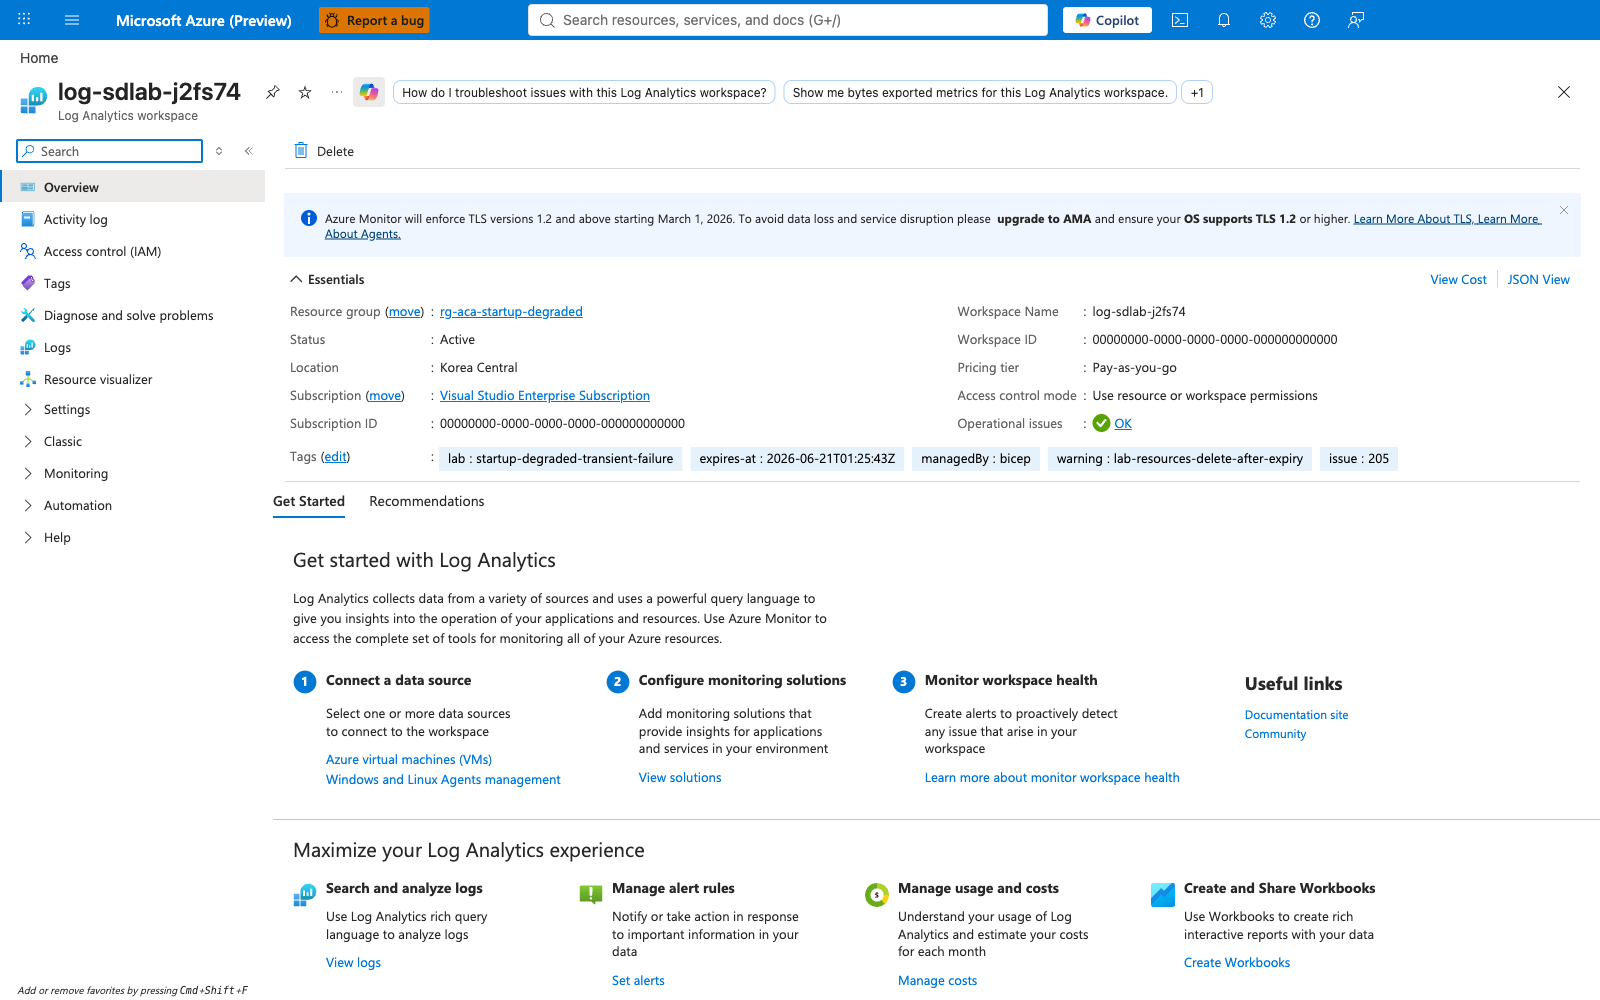
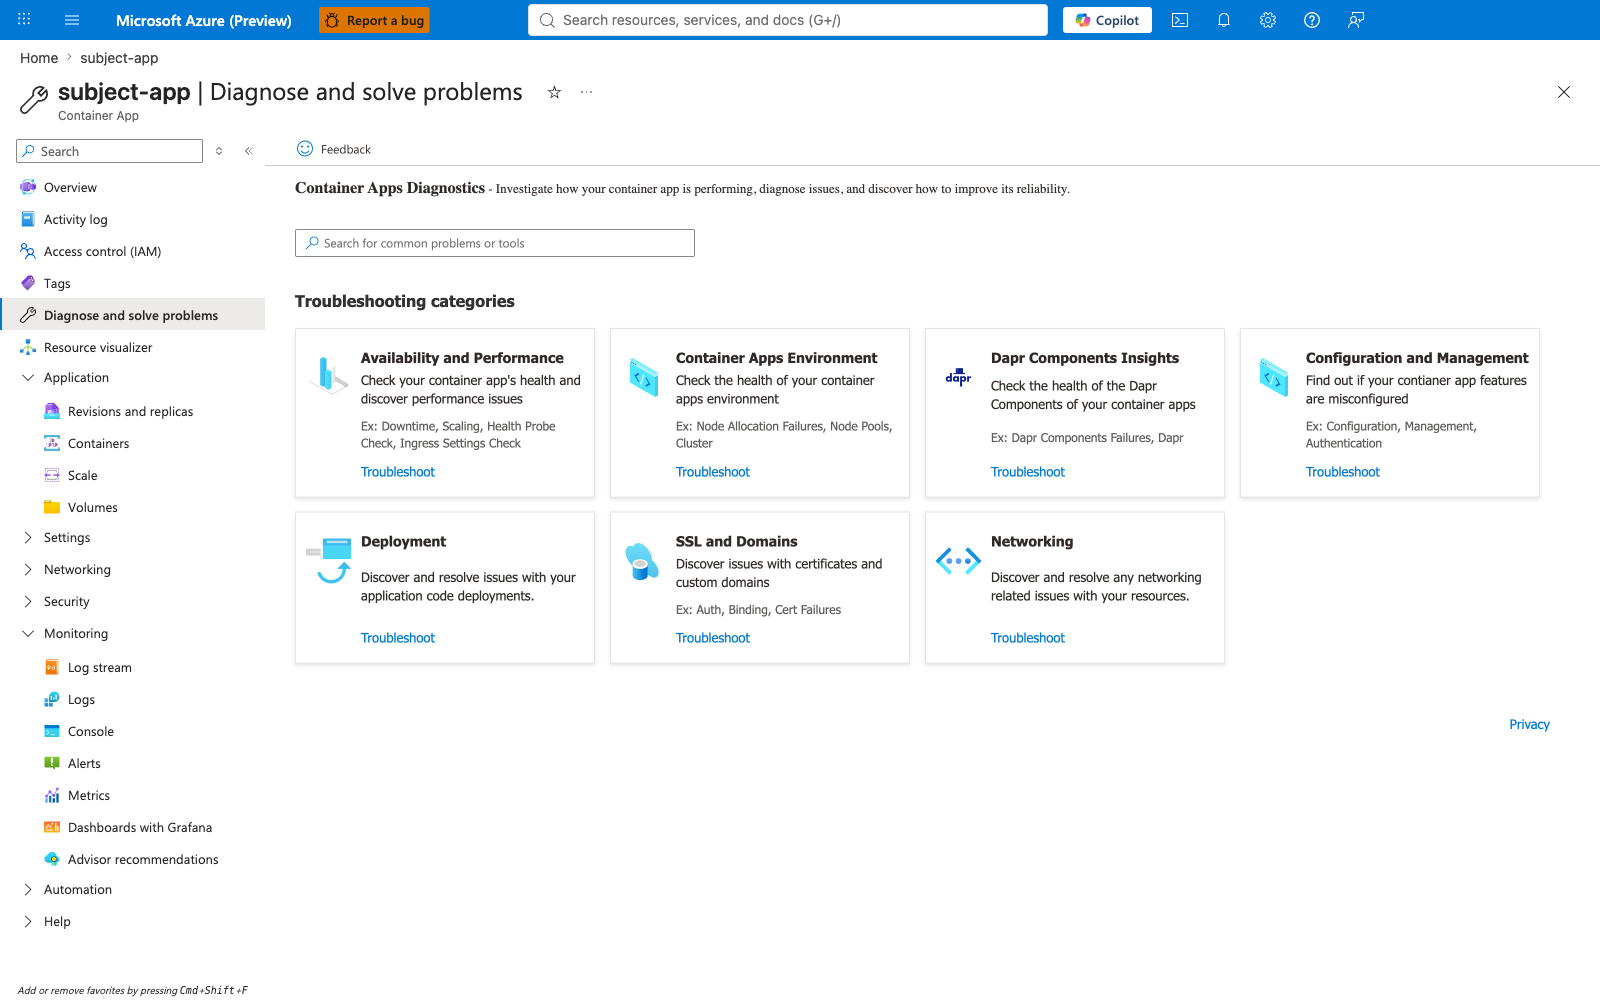
[Strongly Suggested] The baseline cluster is the negative control: it documents that the lab infrastructure is provisioned correctly, the probes target the dedicated /healthz path (not the workload / path — the most common probe misconfiguration), and the baseline loadgen run produced zero 5xx. Without this control, a zero-5xx perturbation result would be inconclusive.
Perturbation events 1 & 2 in flight (captures 19-26)
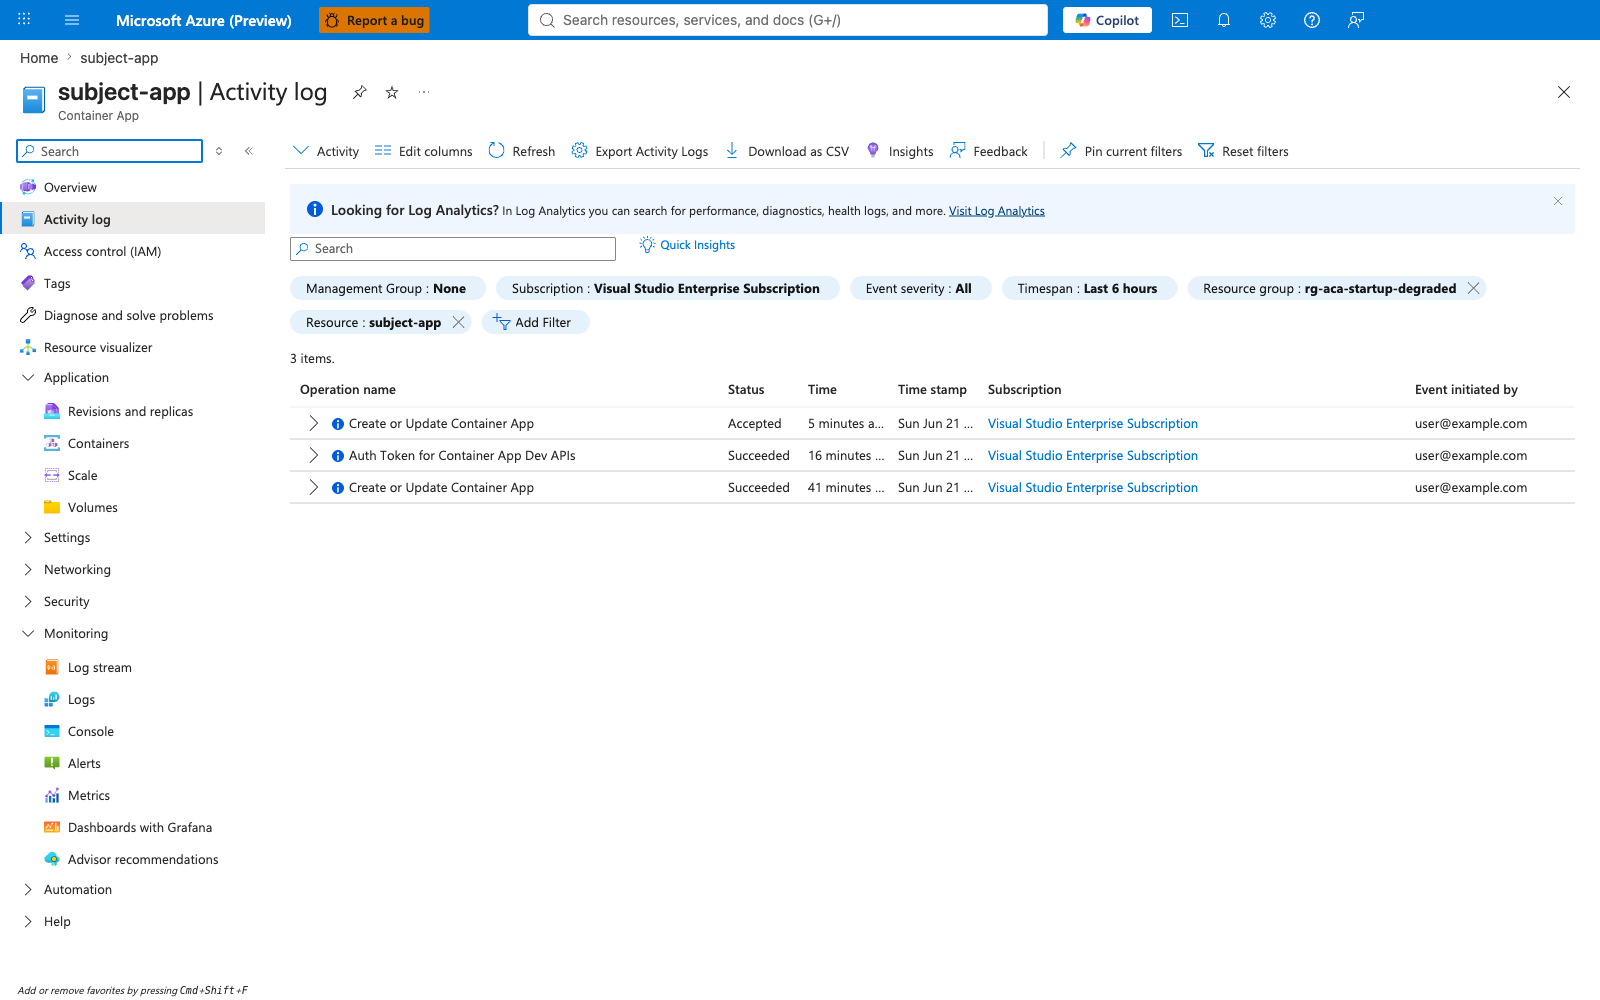
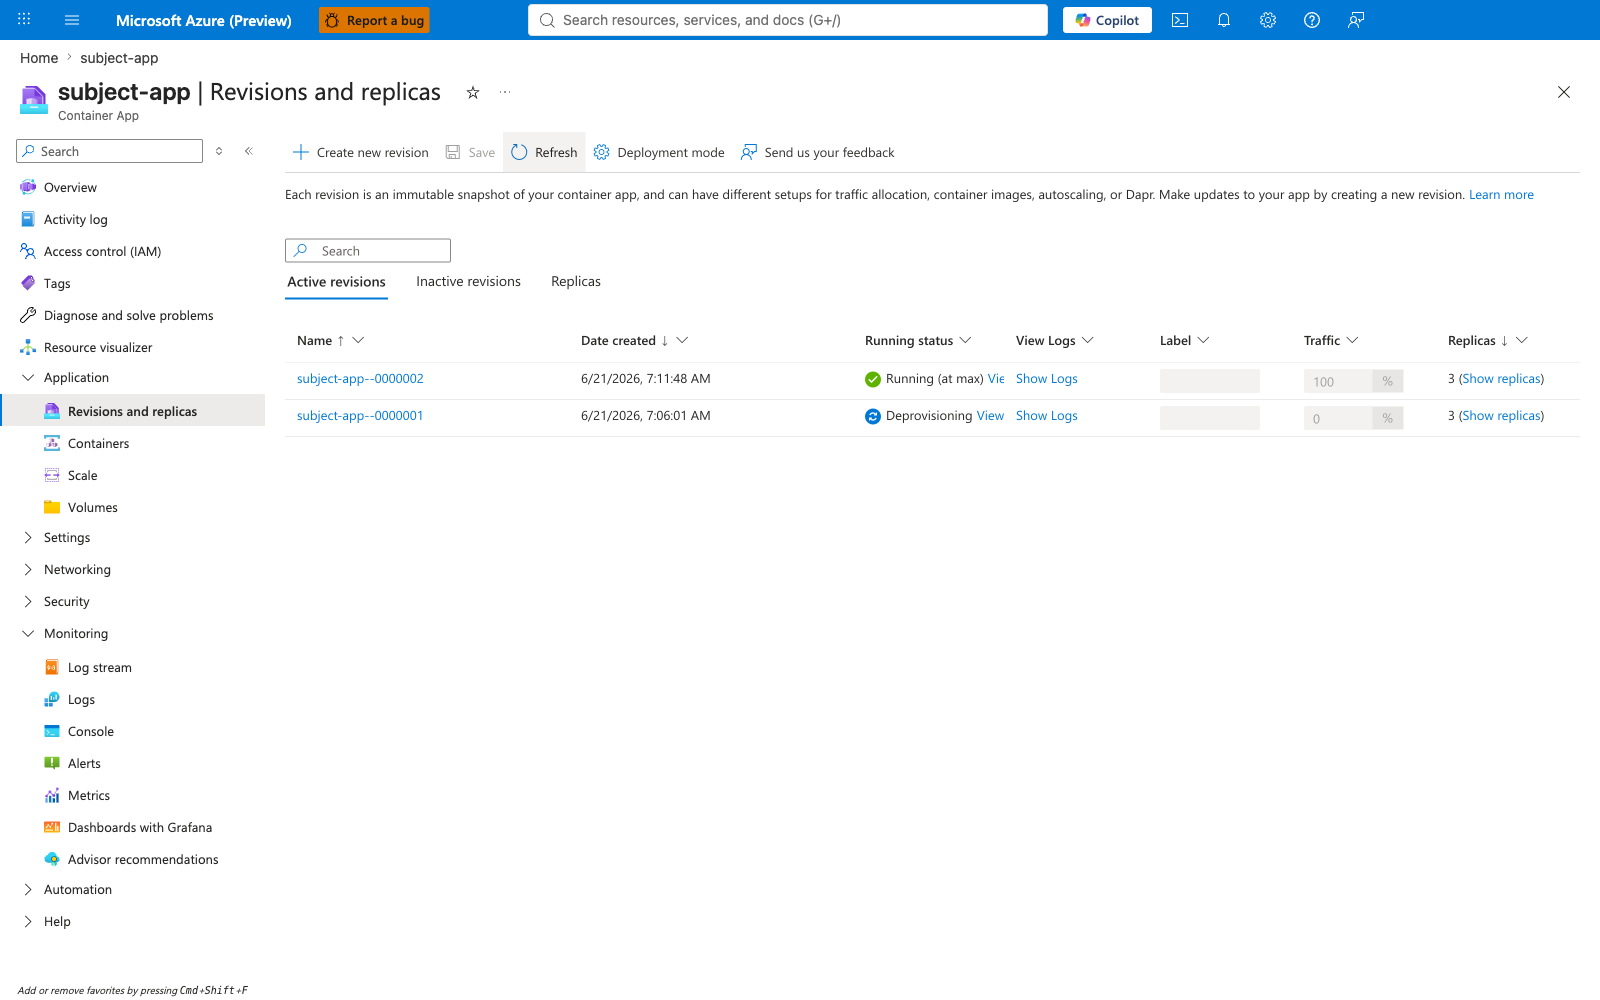
[Observed] During perturbation events 1 and 2, the subject app's Revisions and Replicas grid shows the rolling rollout in progress — old revision scaling down while new revision scales up — and the Activity log records the Microsoft.App/containerApps/write operation that triggered the new revision via ROLLOUT_GENERATION env-var change.
Perturbation event 3 + post-experiment state (captures 27-32)
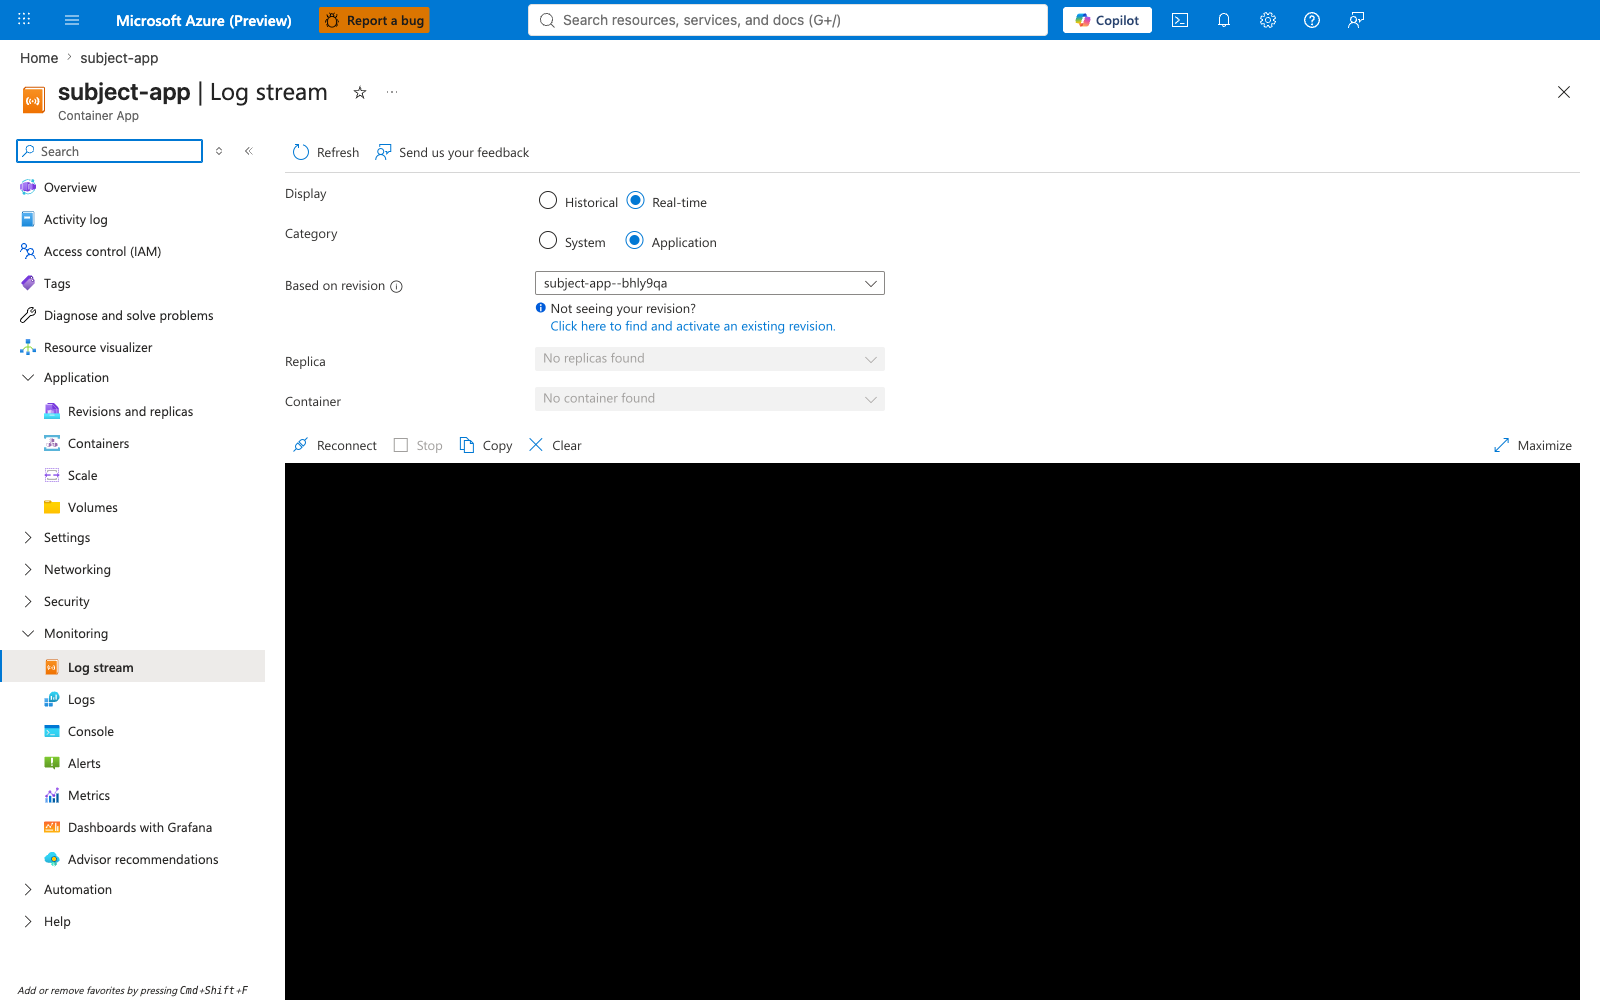
[Observed] Event 3 transition + post-perturbation views: the final revision subject-app--0000003 becomes the active revision; the Log Stream blade shows no error-level entries during the transition; the Event logs blade shows the platform's RollingRevisionCompleted markers.
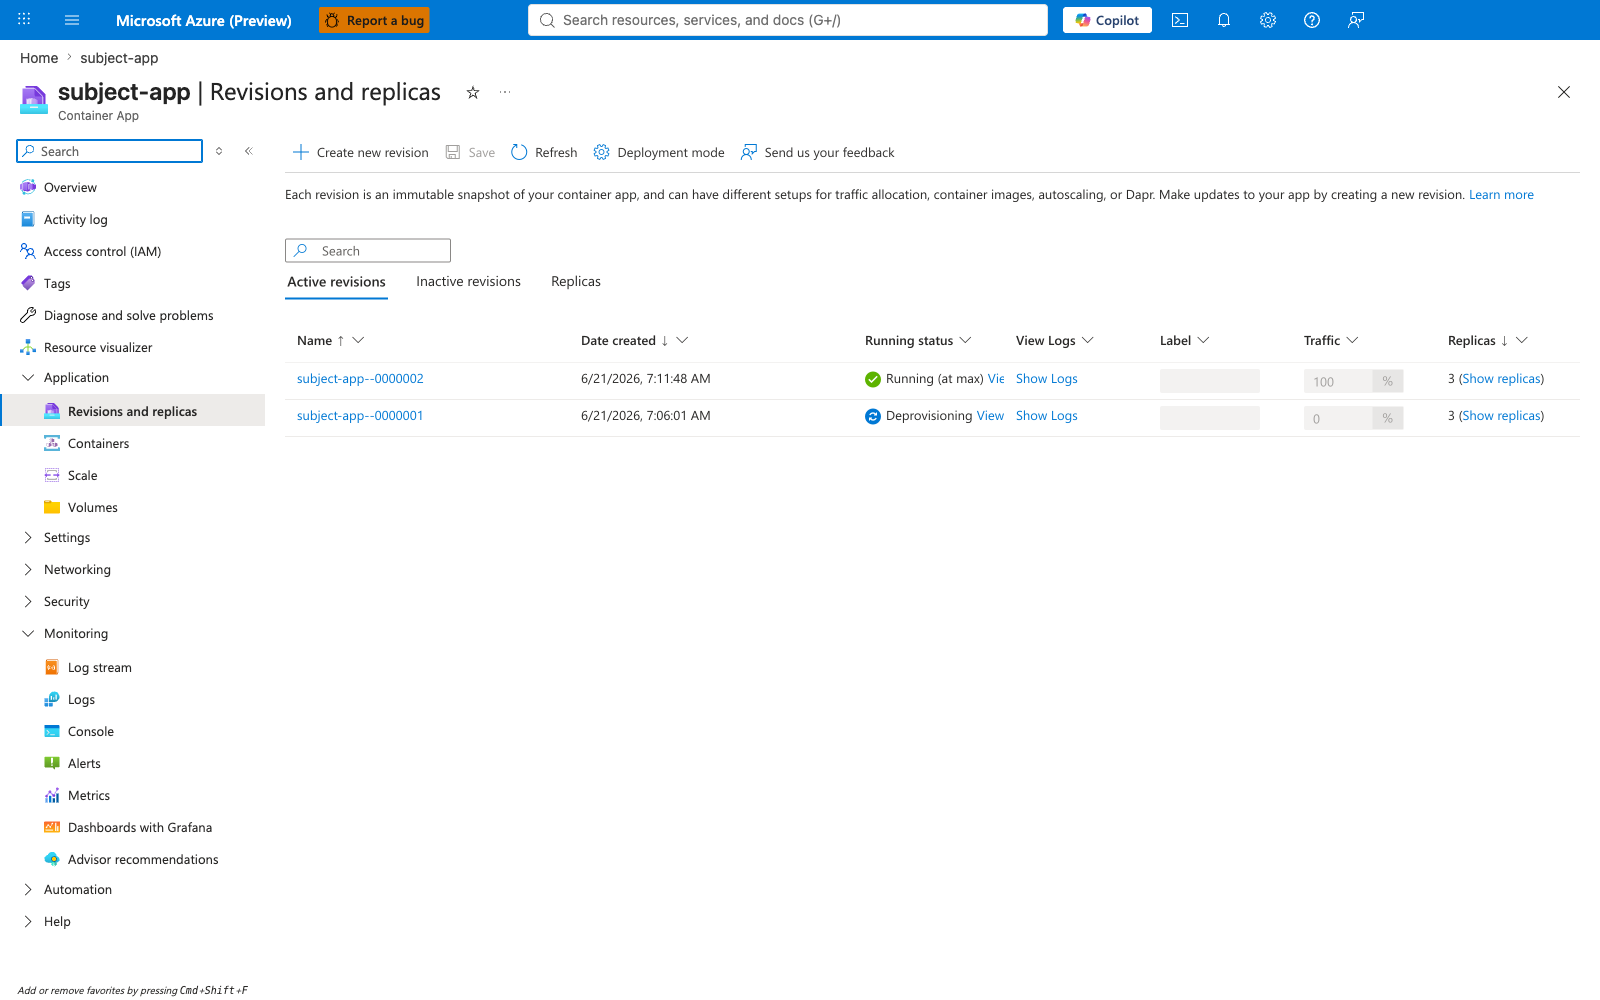
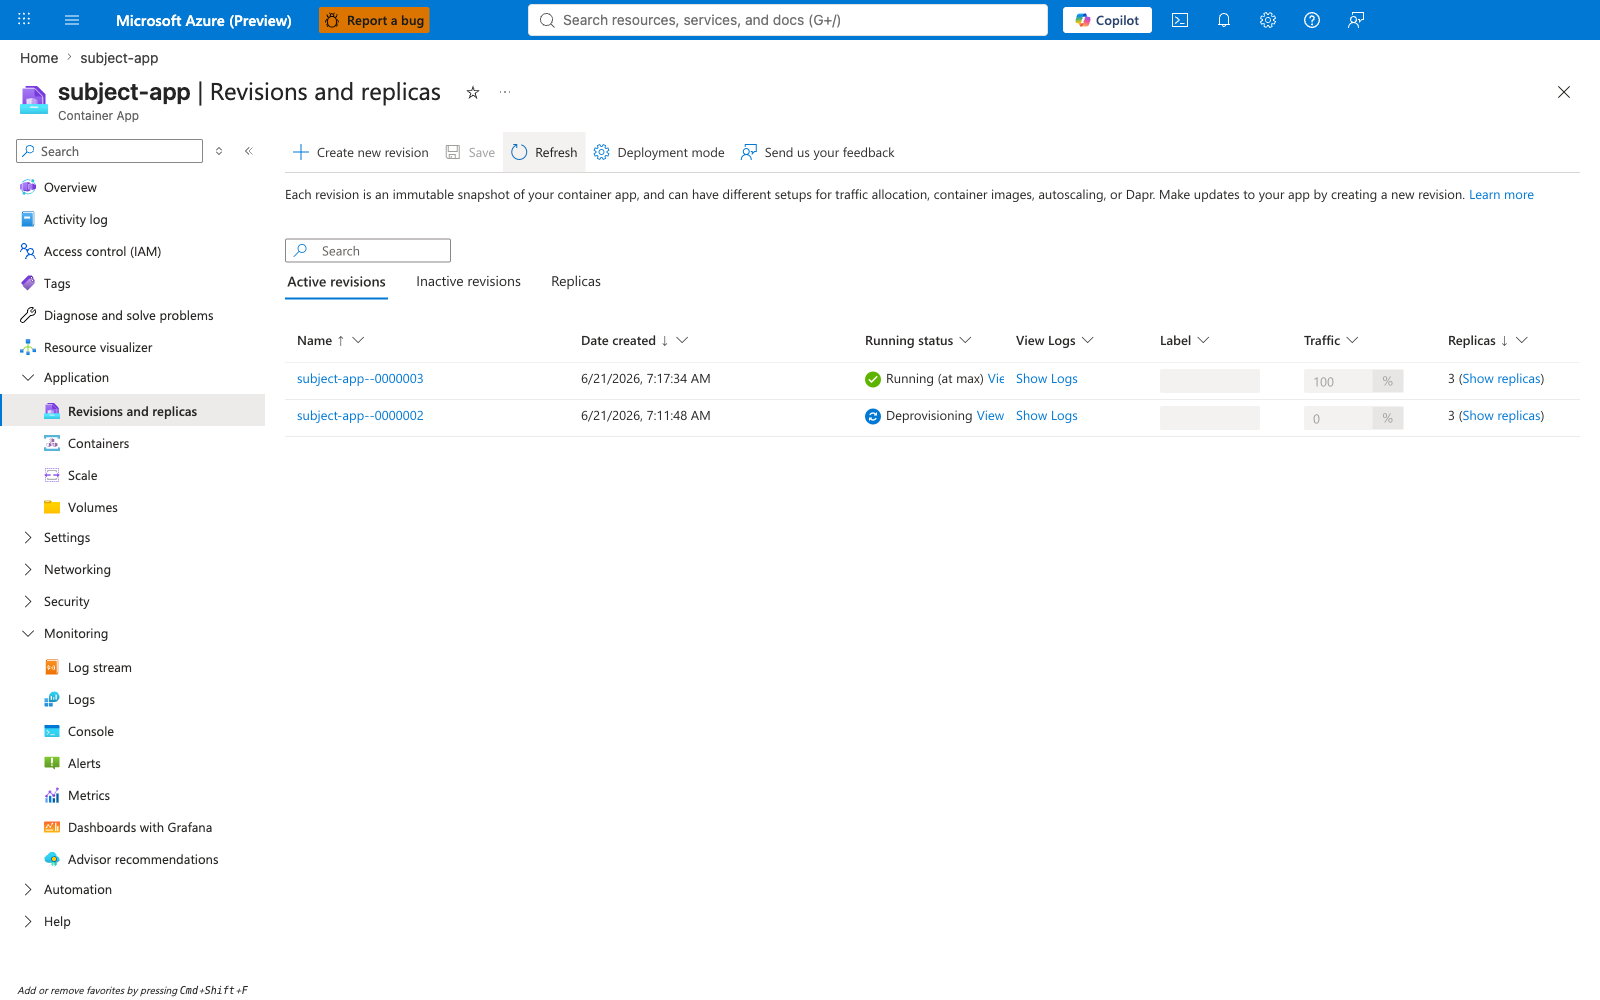
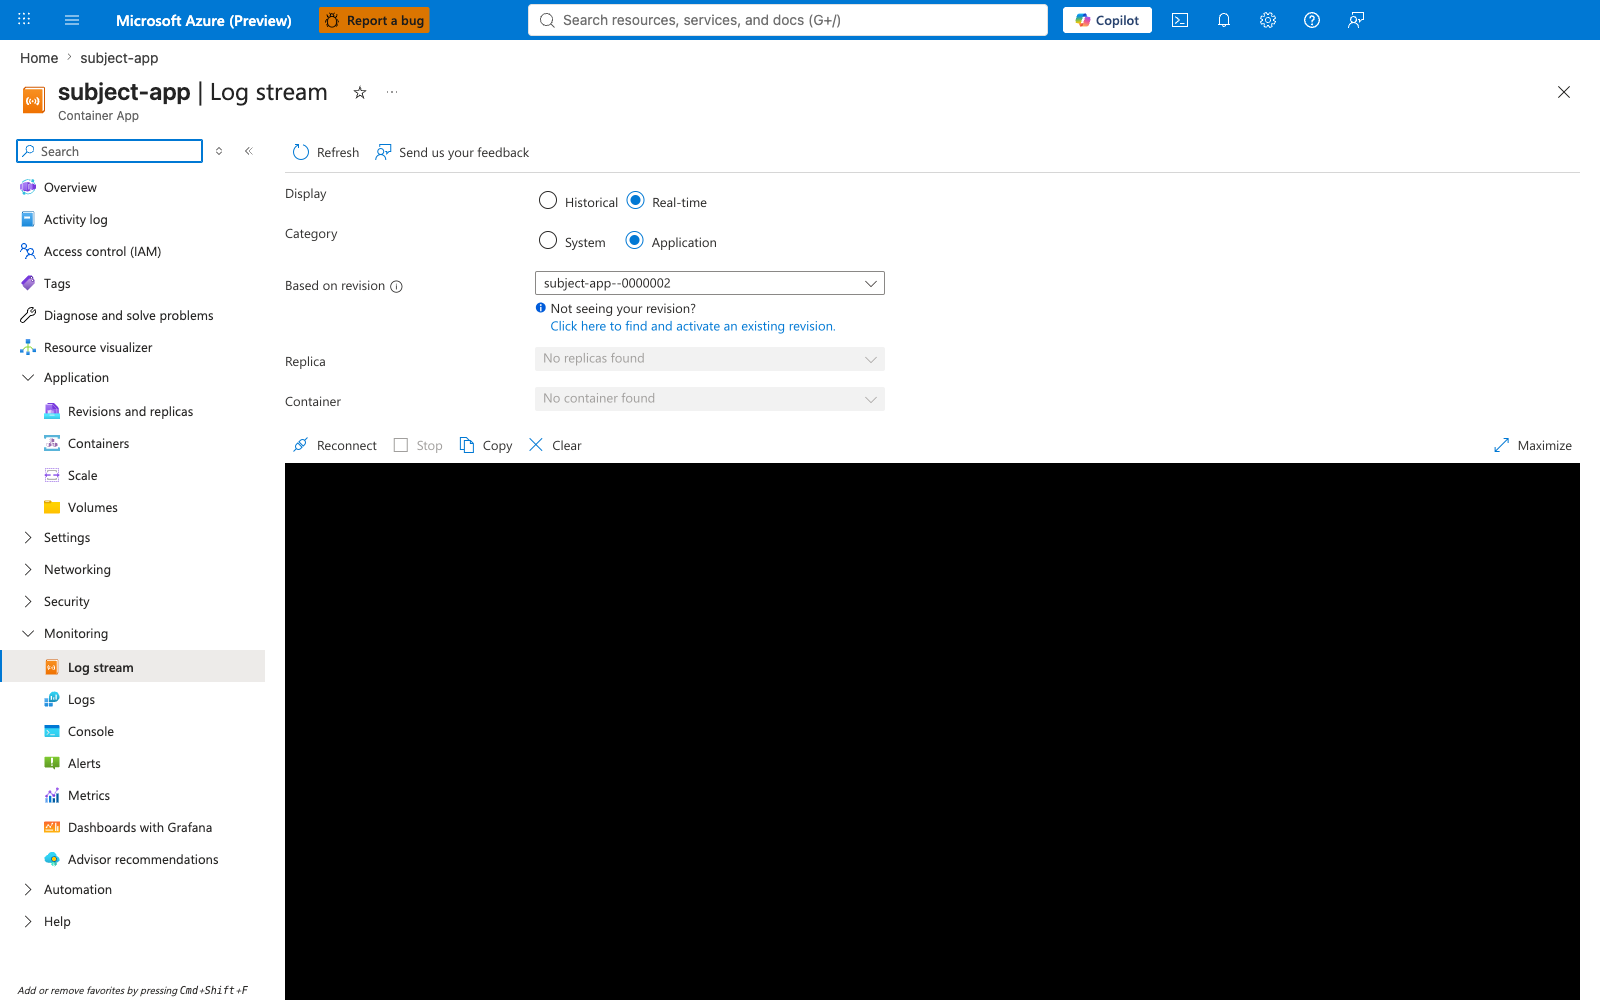
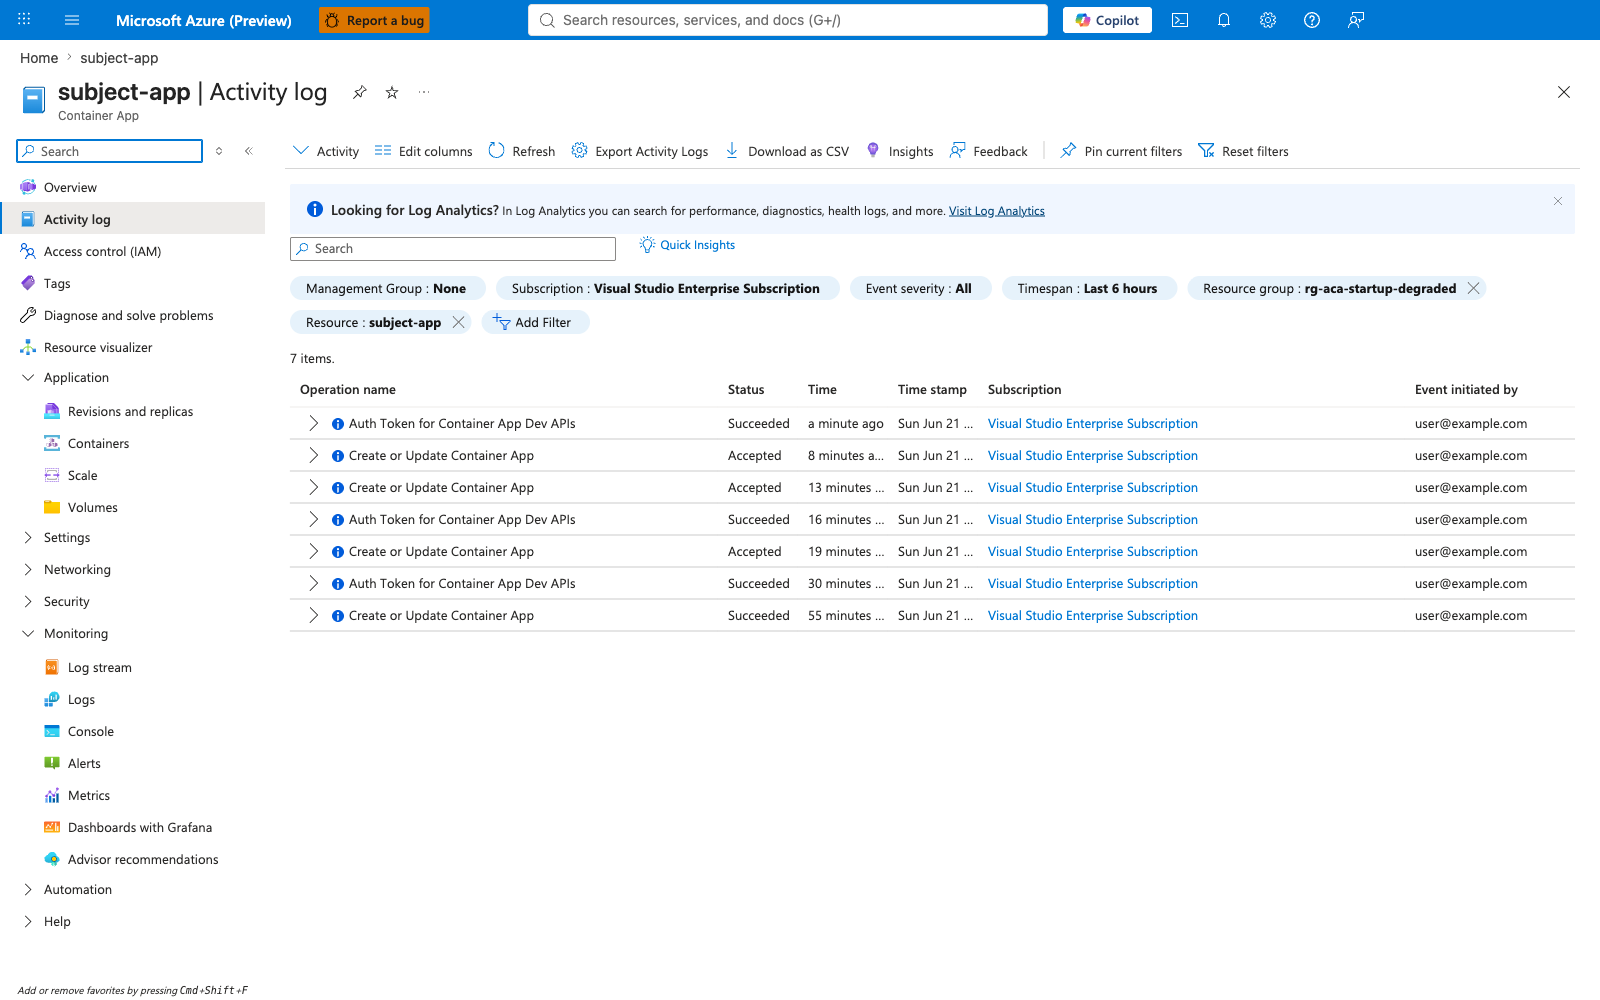
[Strongly Suggested] The Log Stream and Event log captures during and after the 3 rolling rollouts contain no error-level entries from the subject container — consistent with the [Measured] zero-5xx verdict in Section 7 Q2.
LAW Logs evidence — the ZERO-ERRORS smoking gun (captures 33-39)
[Observed] The LAW Logs blade results for the KQL queries documented in Section 7-8. Capture 37 is the gold visual: 126 buckets across both baseline-20260620213447 and perturbation-20260620220432 runs, all with err_total == 0, including the 3 perturbation events. This is the Portal-level confirmation of the Section 8 Q5 falsification verdict.
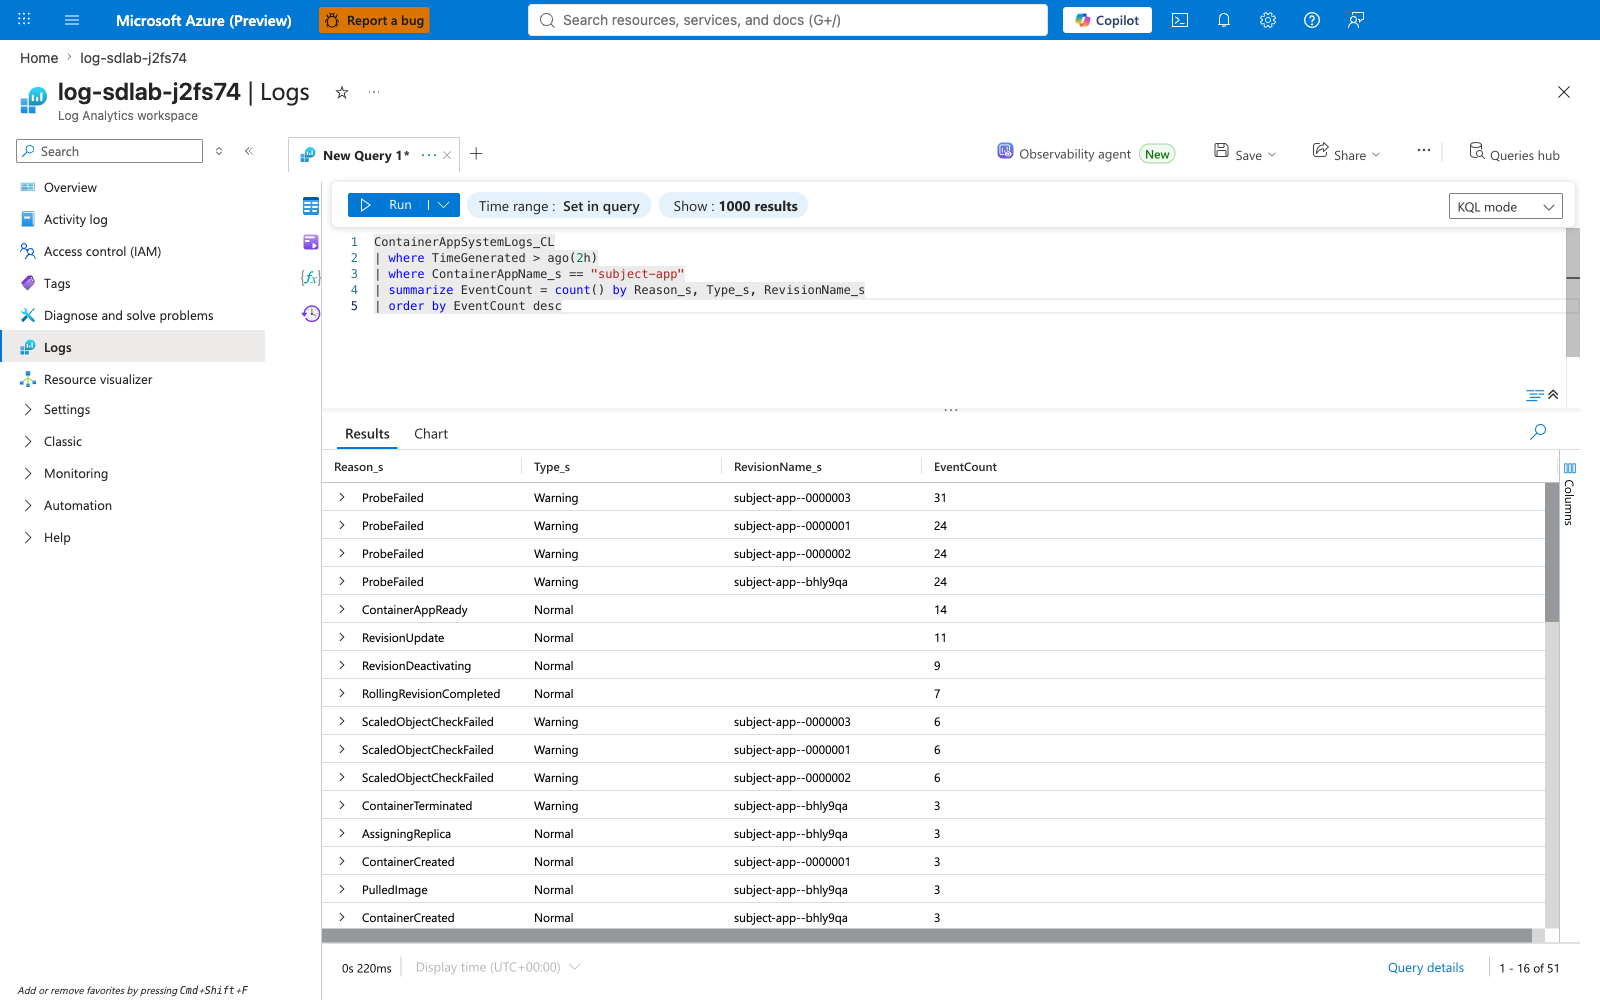
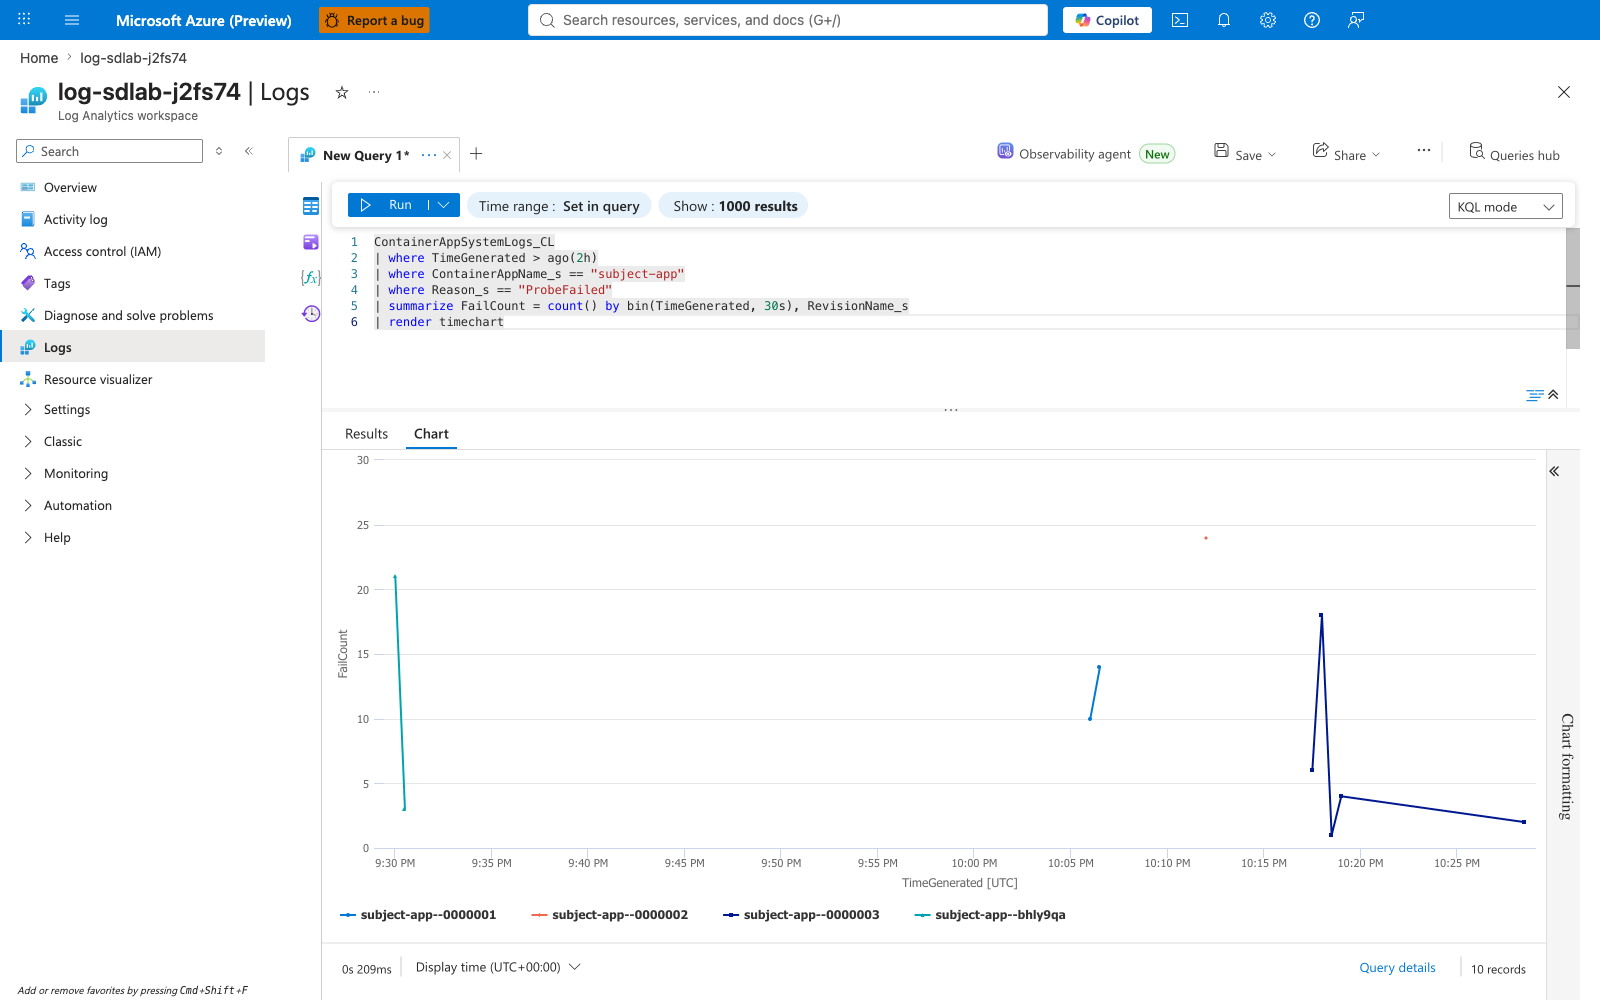
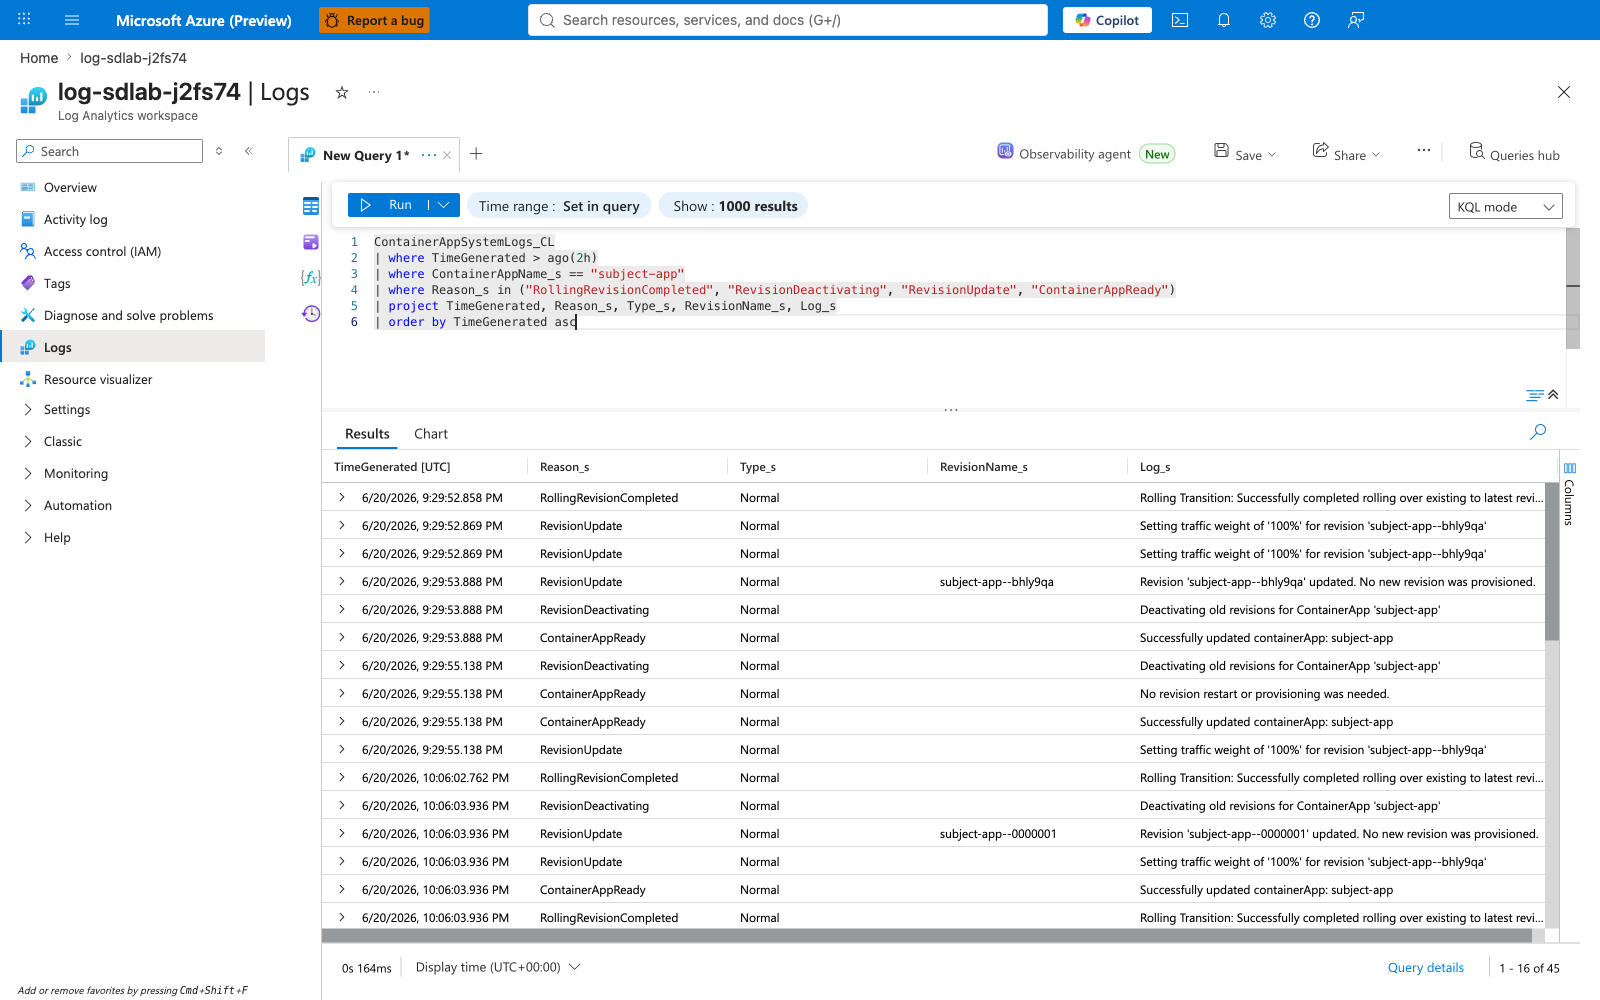
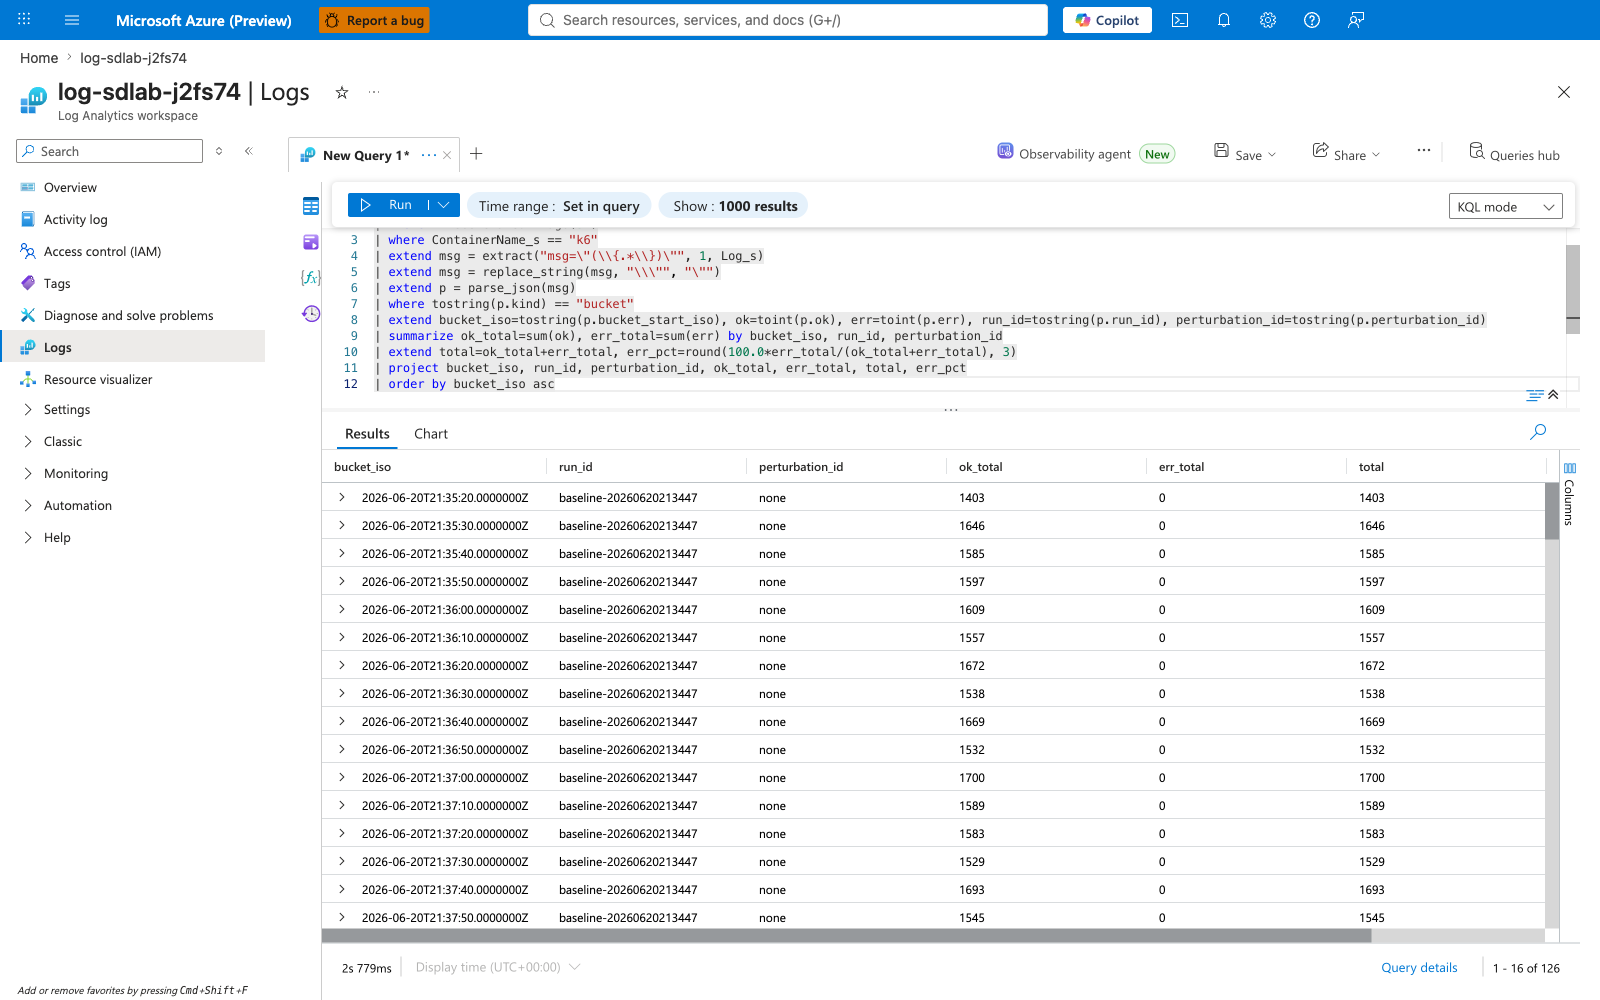
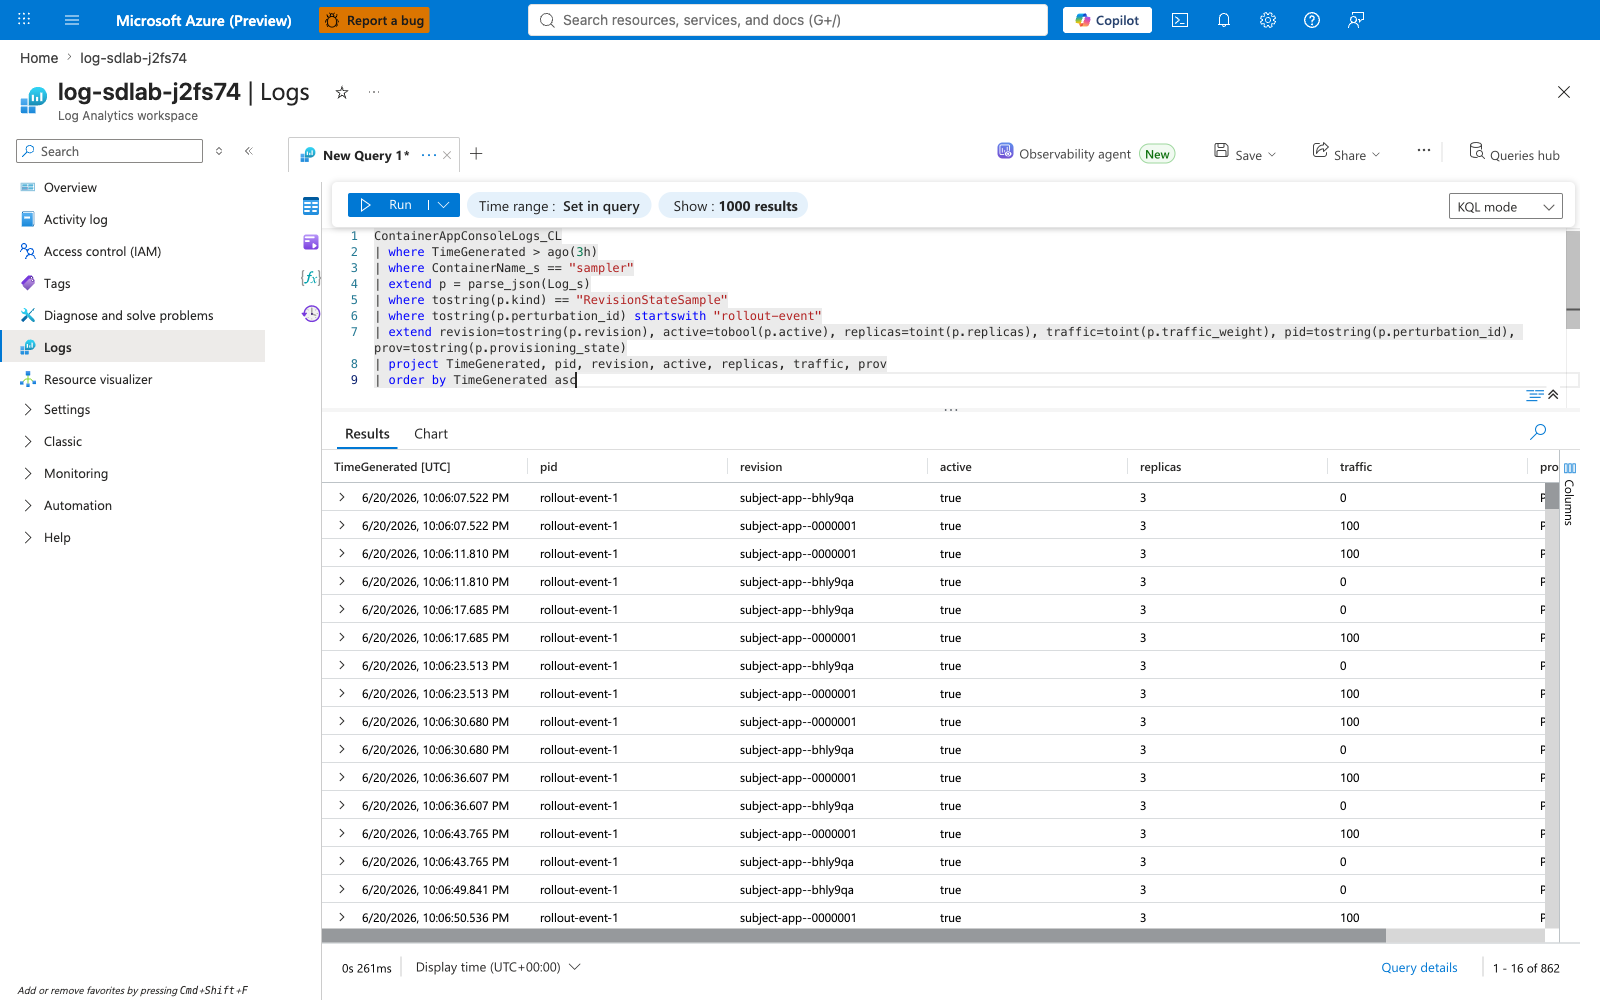
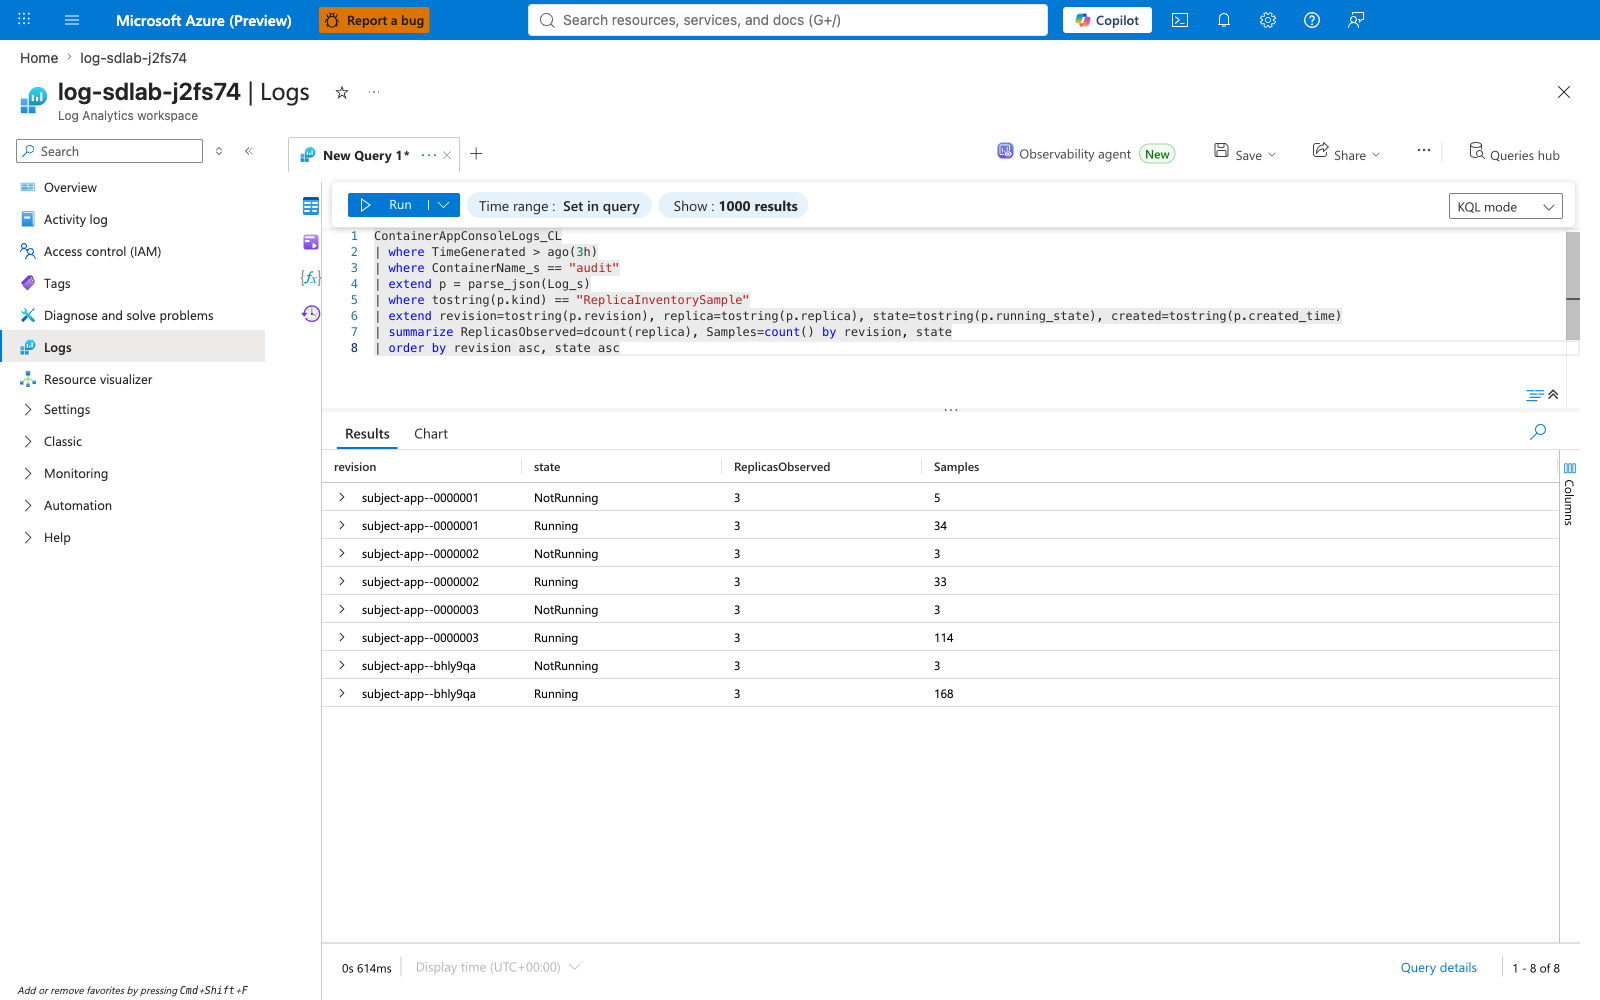
[Strongly Suggested] The combination of captures 33, 35, and 37 is corroborative evidence: capture 37 visually confirms zero client-visible bucket errors, while capture 35 suggests probe failures occurred server-side without corresponding client-visible 5xx. The binding falsification verdict still comes from Q5/Q2 in Sections 8 and 11, not from the Portal timechart.
Companion job lifecycles (captures 40-42)
[Observed] All three companion jobs (perturbation-sampler, loadgen-k6, audit-sampler) execution-history blades. The perturbation-sampler ran 3 times (one per event) and all 3 are Succeeded. The loadgen-k6 ran twice (baseline + continuous) and both are Succeeded. The audit-sampler shows 15 prior executions as Failed and 1 currently Running — see Known issues below for the explanation.
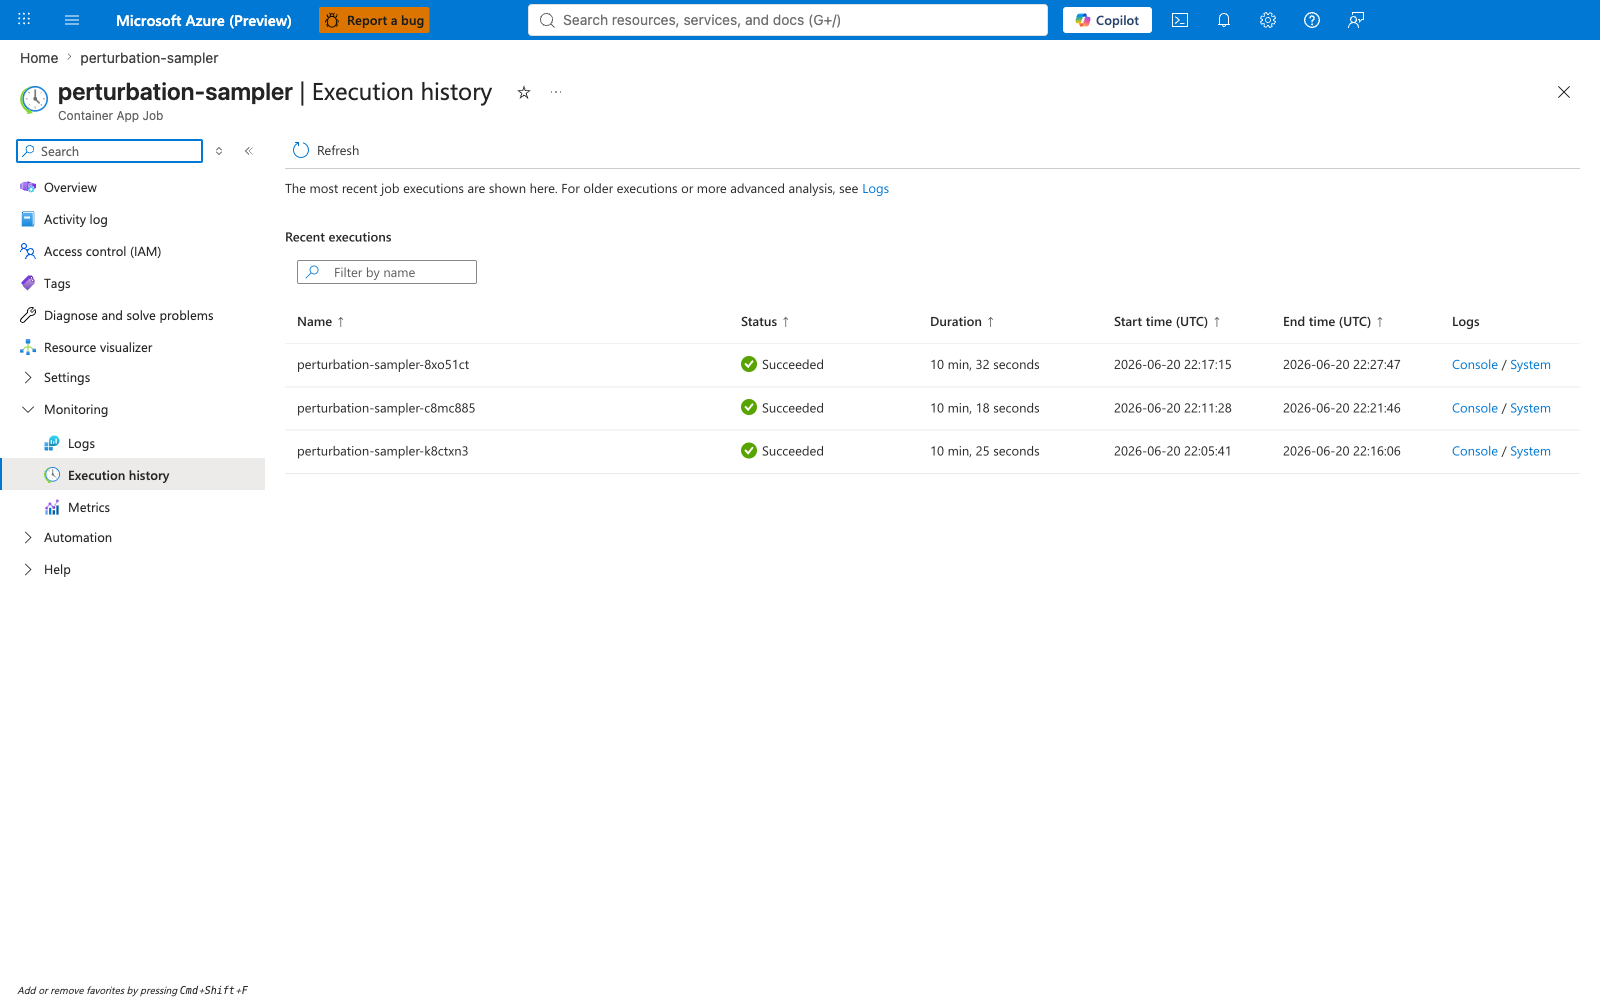
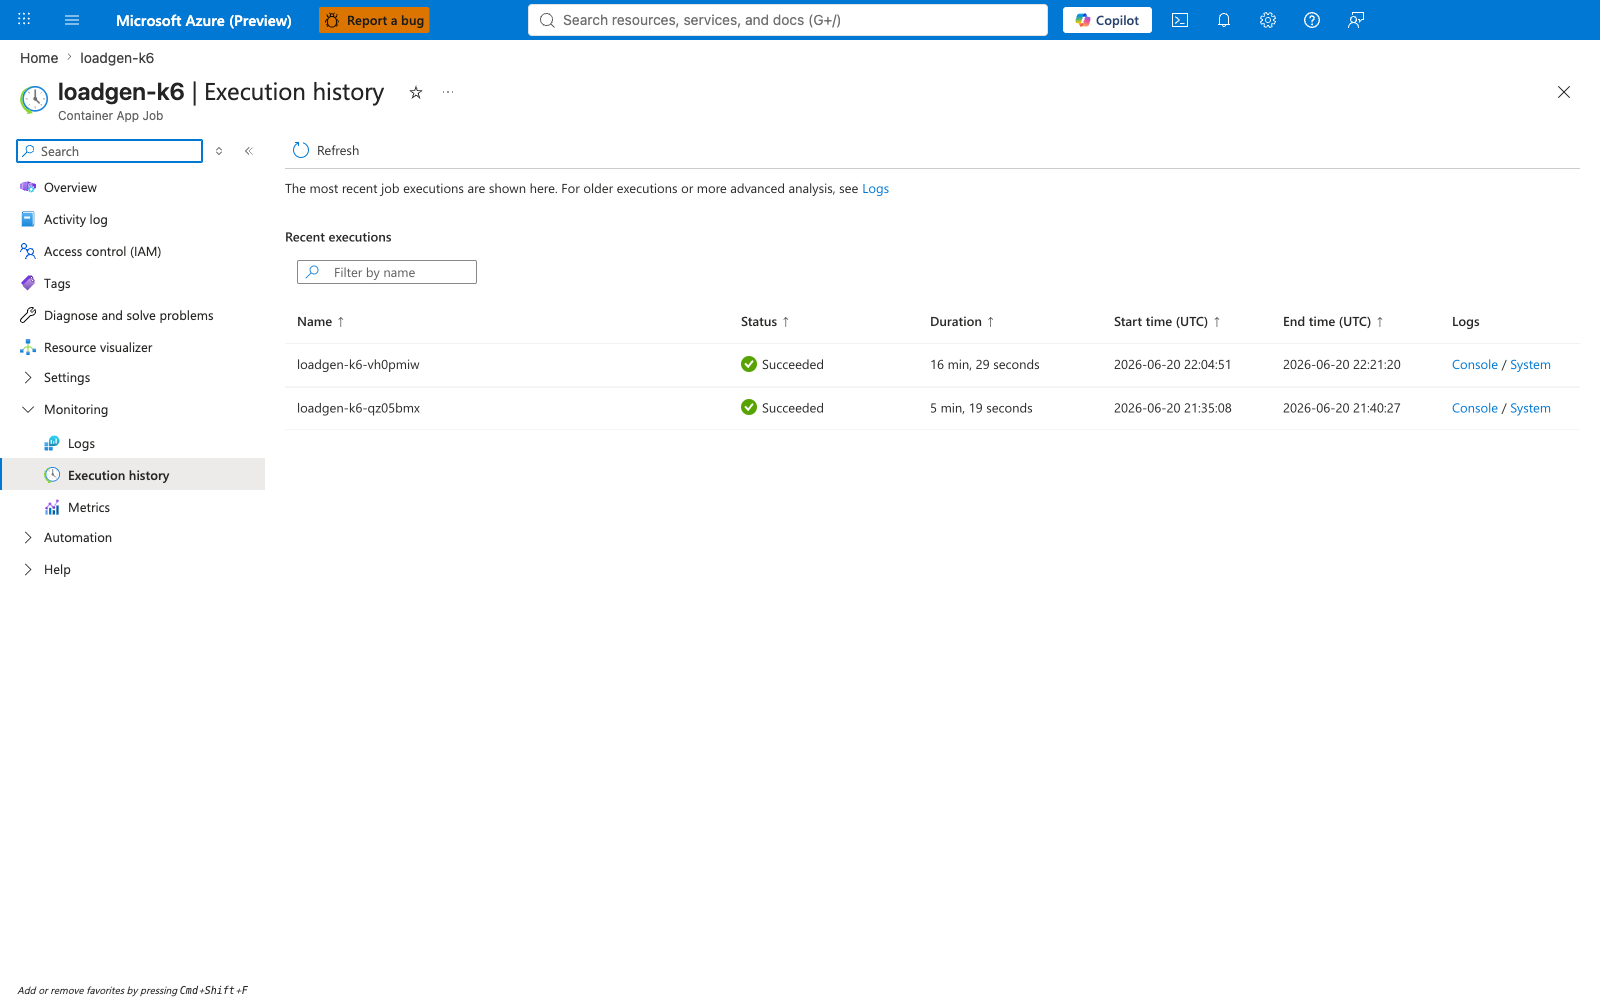
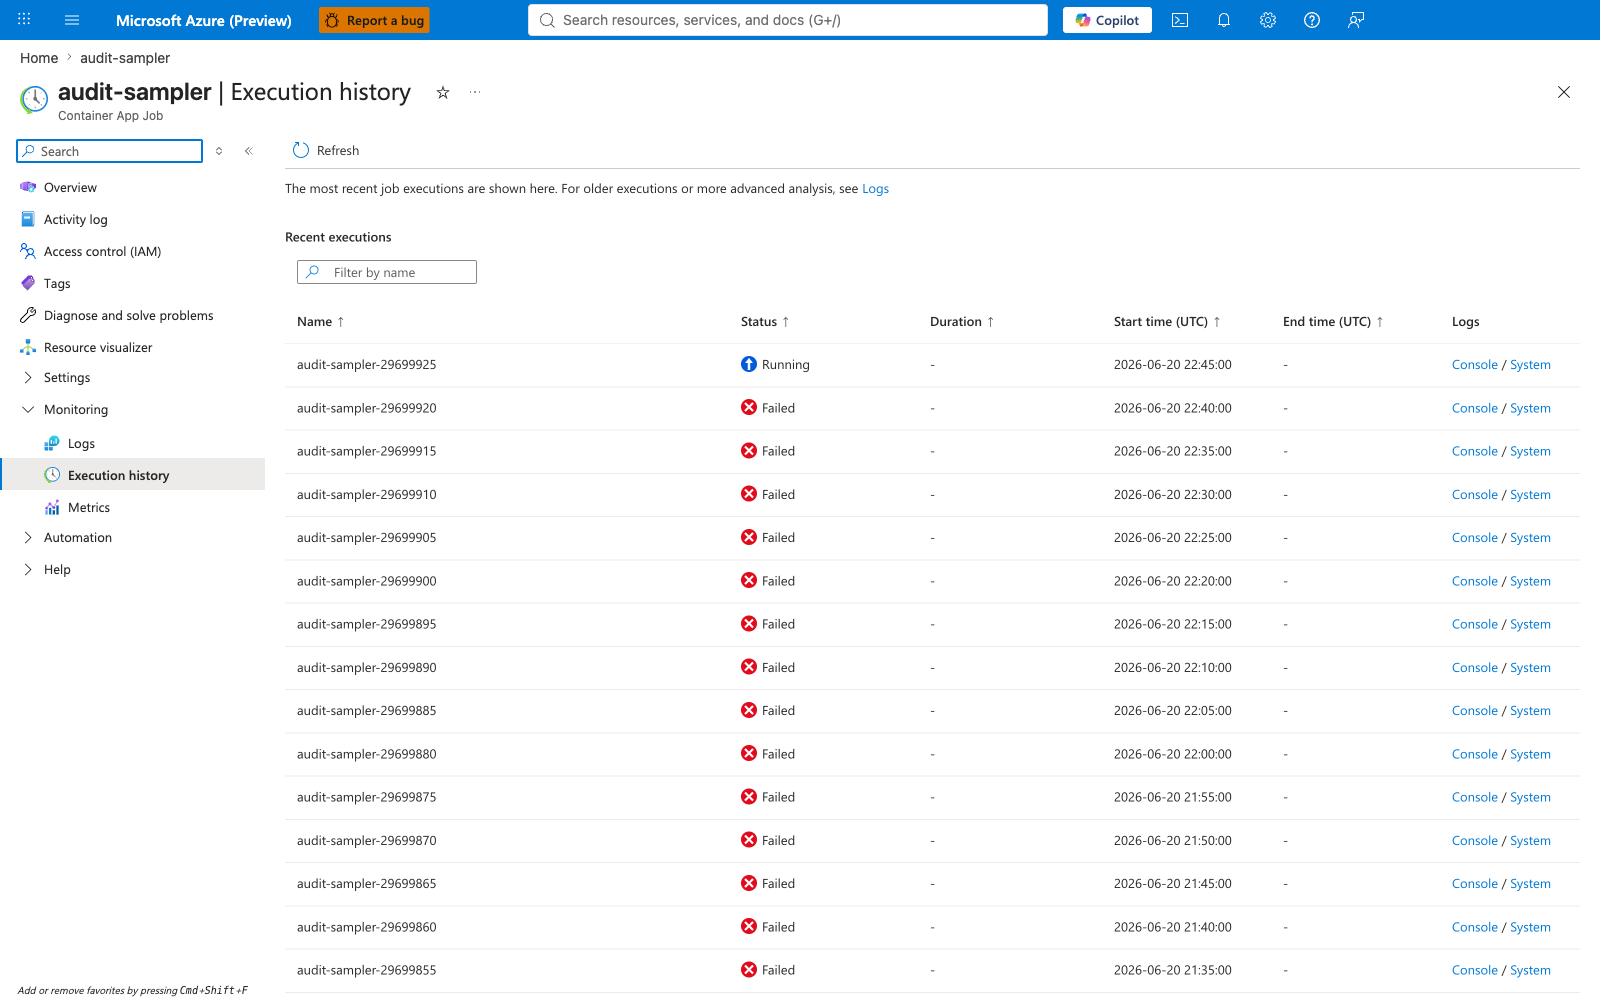
Final state (captures 43-44)
[Observed] Post-experiment state: subject-app overview shows the final active revision subject-app--0000003 after all 3 rollouts completed; LAW overview shows post-ingestion state with the lab's data plane volume.
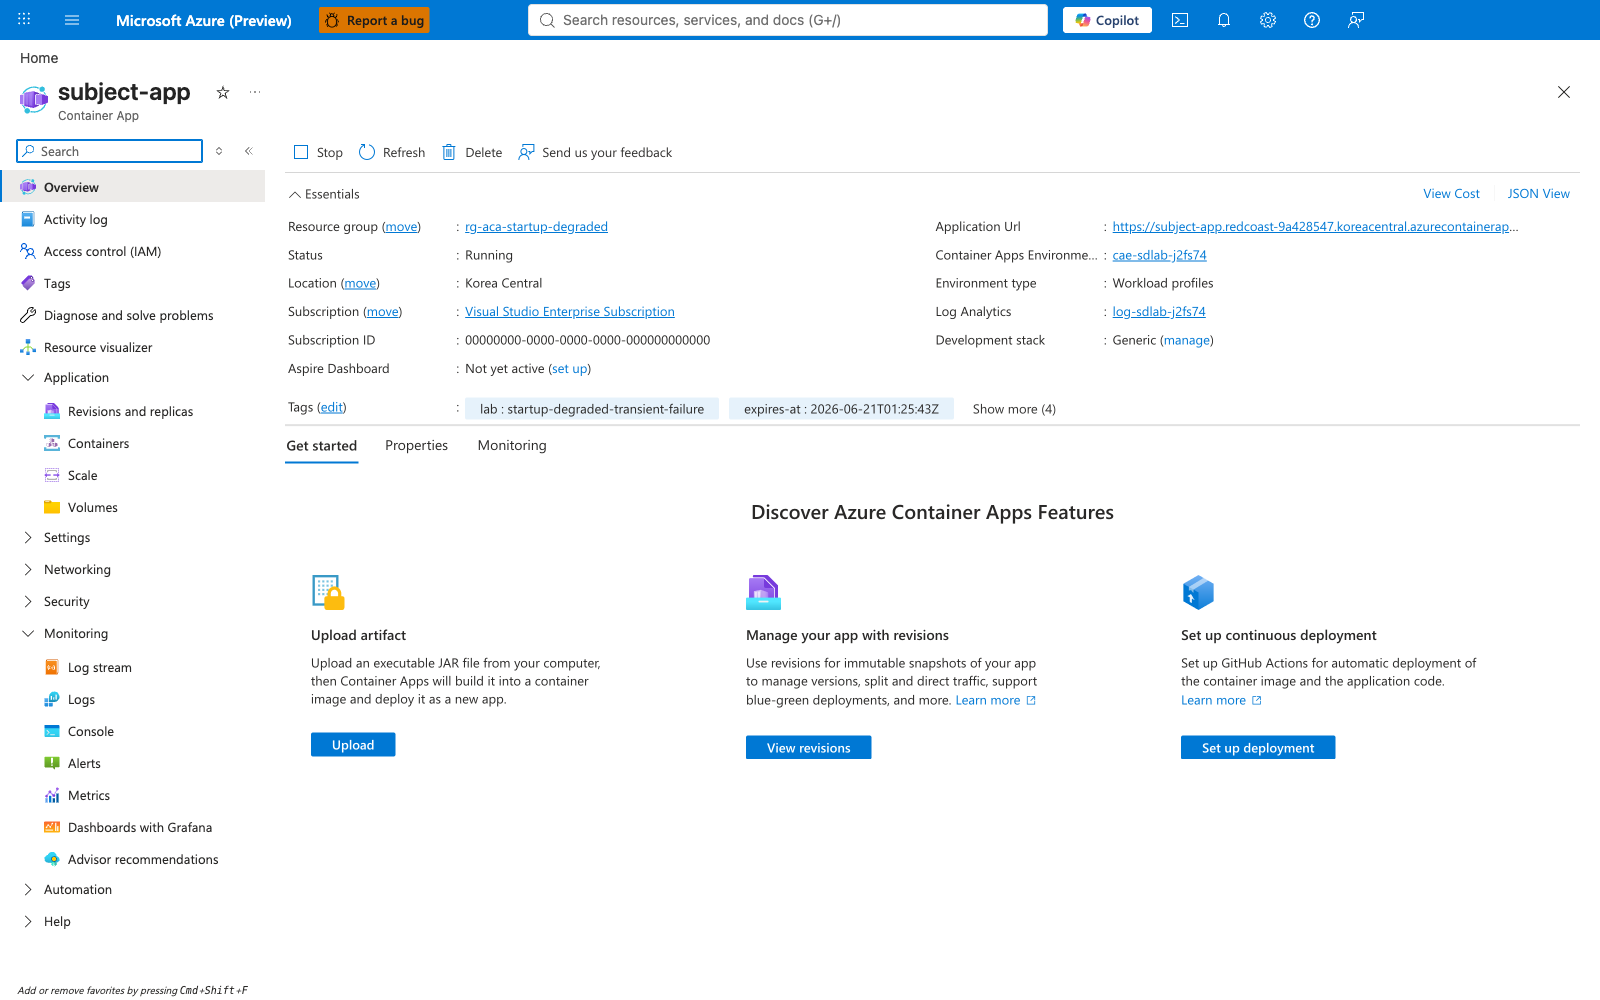
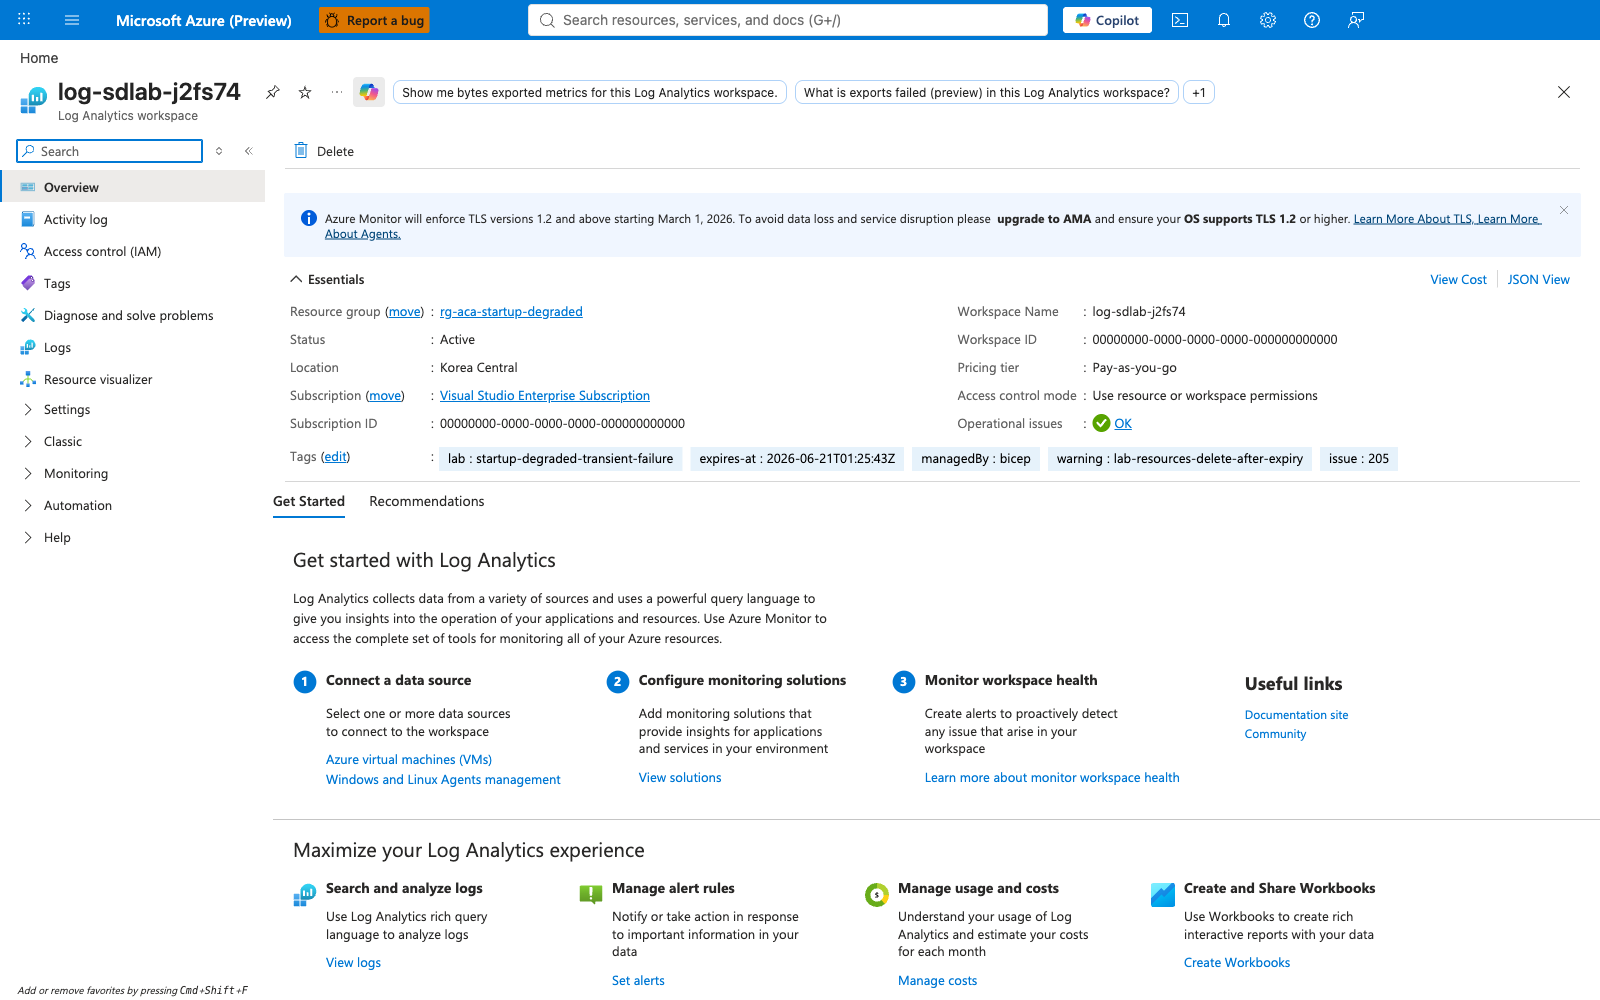
Known issues observed in this repro
The 2026-06-20 repro surfaced four operator-relevant quirks that are NOT failure modes of the lab's hypothesis but could mislead operators during Portal or KQL analysis. They are documented here so operators do not waste time chasing benign artifacts or zero-row queries.
Custom tables _CL gap
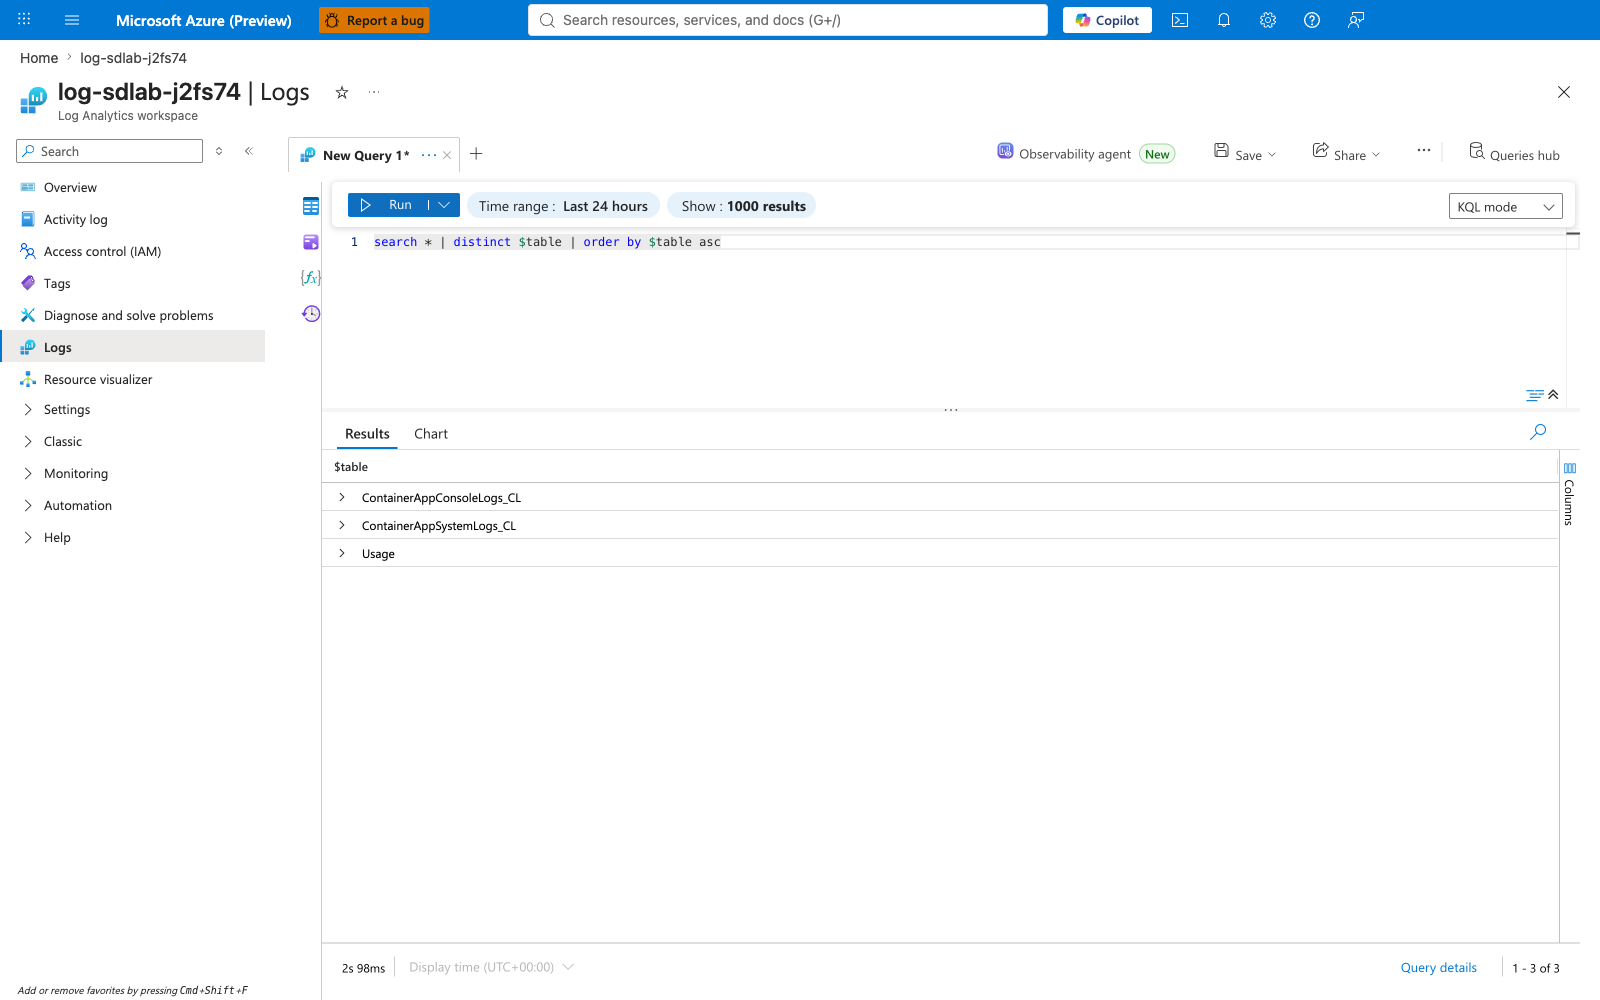
[Observed] Capture 33 shows the LAW Logs blade's left-rail Tables list. Only 3 base tables exist: ContainerAppConsoleLogs_CL, ContainerAppSystemLogs_CL, and the platform Usage table. No LoadgenSample_CL, RevisionStateSample_CL, ReplicaInventorySample_CL, or PerturbationWindowMarker_CL custom tables exist.
[Inferred] This means all structured lab data is shipped through ContainerAppConsoleLogs_CL.Log_s as JSON-encoded text, and every KQL query in the lab must use parse_json(Log_s) (or for k6, the extract+replace_string+parse_json chain documented in the next subsection). The custom-tables shape that would let an operator write LoadgenSample_CL | where err_pct > 0.5 does not exist; the equivalent query is the one captured in 37 (the k6 bucket aggregate against ContainerAppConsoleLogs_CL).
[Strongly Suggested] Any KQL pack documentation that references *_CL custom tables specific to this lab (e.g., LoadgenSample_CL) is stale and MUST be rewritten to use ContainerAppConsoleLogs_CL + parse_json against ContainerName_s filtered to the relevant container (k6, sampler, audit, subject). The companion KQL reference doc Startup-Degraded Bucketed 5xx KQL Pack is the operative reference; queries that pre-date this repro should be cross-checked against the live tables list.
ContainerName_s actual values differ from job names
[Observed] When parsing ContainerAppConsoleLogs_CL, the ContainerName_s values do NOT match the job names. The actual values for this lab:
| Job/App name | ContainerName_s value | Records (this repro) |
|---|---|---|
loadgen-k6 | k6 | 244,374 |
subject-app | subject | 203,334 |
perturbation-sampler | sampler | 1,921 |
audit-sampler | audit | 583 |
[Inferred] The mapping is ContainerName_s = the container name from the Bicep template's containers[].name field, not the Job/Container App name from the parent ARM resource. KQL queries that filter on ContainerName_s == "audit-sampler" (using the job name) will return zero rows; the correct filter is ContainerName_s == "audit".
k6 logs are wrapped in time="..." msg="..." format
[Observed] The k6 container emits structured JSON to stdout, but k6's logger wraps each line in a logfmt envelope: time="2026-06-20T22:04:35Z" level=info msg="{\"kind\":\"bucket\",\"window_s\":10,...}" source=console. The wrapped JSON cannot be parse_json-ed directly from Log_s.
[Strongly Suggested] The working KQL pattern (captured in 37) extracts the inner JSON, unescapes the backslash-escaped quotes, then parses:
ContainerAppConsoleLogs_CL
| where TimeGenerated > ago(3h)
| where ContainerName_s == "k6"
| extend msg = extract("msg=\"(\\{.*\\})\"", 1, Log_s)
| extend msg = replace_string(msg, "\\\"", "\"")
| extend p = parse_json(msg)
| where tostring(p.kind) == "bucket"
| ...
The sampler and audit containers emit plain JSON (no logfmt wrapper) so parse_json(Log_s) works directly for them.
audit-sampler "Failed" executions are benign
[Observed] Capture 42 shows the audit-sampler Execution history blade: 15 prior executions all marked Failed (one every 5 minutes from 21:30:25Z to 22:40:00Z), with the current 22:45:00Z execution still Running. The endTime for the most-recent Failed execution is null (verified via az containerapp job execution show).
[Inferred] The audit-sampler job spec has replicaTimeout=240 (4 minutes), but the audit container runs as a long-lived sampler daemon that emits a ReplicaInventorySample every 30 seconds. The platform sends SIGTERM at the 240-second mark, the container exits with a non-zero code, and Container Apps marks the execution as Failed. Data ingestion is unaffected: the audit container's first ~240 seconds always succeed, and the next execution at the next 5-minute cron mark continues sampling.
[Strongly Suggested] Evidence that this is benign:
auditcontainer produced 583 records inContainerAppConsoleLogs_CLduring the repro window — covering all 4 revisions × Running/NotRunning state (capture 39).- The
qB-replica-inventory-*.jsonraw export shows 342 unique sample rows with complete revision/replica/state attribution. - The audit-sampler's purpose (cross-correlating revision state against replica inventory at a 5-minute coarse cadence) is fulfilled despite the "Failed" status badge.
[Strongly Suggested] Operators MUST NOT alert on audit-sampler execution failure count. The "Failed" status is a Portal-level artifact of the timeout-eviction lifecycle, not a data-ingestion failure. Remediation options (documented in evidence/qG-audit-sampler-quirk-*.json):
- Accept Failed status (current design; this lab) — data is complete, only the Portal badge is misleading.
- Trap SIGTERM in the container script and exit 0 — would mask the "Failed" badge but also mask any real (non-timeout) container failures. Not recommended.
- Change job semantics from cron-daemon to one-shot snapshot — would lose the continuous sampling cadence that the lab's analysis depends on. Not recommended.
This is NOT a finding about Container Apps' reliability — it is a documented interaction between long-running container daemons and Container Apps' job replicaTimeout semantics, and it does not affect the lab's H0 verdict.
13. Solution
For the perturbation phase (12 rolling-rollout events at 200 RPS), the lab found no client-visible 5xx requiring mitigation — H0 held under tested conditions. For the supplemental phase (3 az containerapp revision restart events at 200 RPS), the lab found a single client-visible 5xx out of 289,932 requests (0.000345%, single 0.062% bucket, falsification rule not triggered) — H0 also held under tested conditions per the binding rule, but with a documented operational asymmetry vs the rolling-rollout phase. No application-layer solution is required for the same configuration. However, the conditions for those null results are narrow (see Section 10's "Tested" / "NOT tested" lists); the following mitigations apply if H0 is later falsified at the customer's specific configuration (different probe configuration, longer startup delay, higher RPS, or different perturbation type):
- Increase
revisionWeightramp duration in the traffic configuration to give the new revision more warm-up time. - Configure
terminationGracePeriodSecondsand verify the subject app's SIGTERM handler drains in-flight requests cleanly before exiting. - Prefer rolling rollouts managed by Container Apps over
az containerapp revision restartwhen zero errors are required. The supplemental phase measured one error per ~290,000 requests for explicit restart vs exactly zero for rolling rollout under identical load — both clear the falsification bar, but the restart path produced a non-zero error rate. The binding caps the "platform-initiated cause" of the single supplemental error at[Strongly Suggested]. - Add an external retry-with-jitter layer (CDN, API gateway, client SDK) for any client whose SLO does not tolerate the measured
worst_bucket_err_pctof either phase.
The choice between a rollout managed by Container Apps and az containerapp revision restart is therefore SLO-driven: rolling rollout is the safer default; restart is acceptable when the SLO tolerates ~10^-5 errors during the restart window. If the SLO requires strict zero, restart should be restricted to planned maintenance windows with traffic drained at the ingress layer.
14. Prevention
To prevent this failure mode in production:
- Validate probe configuration before depending on rolling-rollout. The
/workload endpoint MUST NOT be the same as the health endpoint. Use a dedicated/healthz(or equivalent) and verify all three probes (startup, readiness, liveness) target it. Seedocs/best-practices/reliability.mdfor the canonical pattern. - Prefer rollouts managed by Container Apps over
revision restartwhen the SLO requires strict zero errors. This lab's supplemental phase measured 1 error per ~290,000 requests for explicit restart vs exactly 0 errors for rolling rollout under identical load — both clear the falsification rule, but the operational asymmetry is real. Userevision restartfor operations where the SLO tolerates ~10^-5 errors during the restart window; otherwise, restrict it to planned maintenance windows with traffic drained.
15. Takeaway
The core lesson from this lab: across a 12-event rolling-rollout phase and a 3-event explicit-restart phase under identical 200 RPS load, this specific configuration produced 0 vs 1 client-visible 5xx — both phases held H0 under the binding falsification rule, but the outcome is asymmetric. Whether that asymmetry is mechanism-driven (the platform's probe gating + connection management during rolling rollout closes a gap that explicit restart leaves open) or sample-size noise (3 events × ~290k reqs is far less data than 12 events × ~1.14M reqs) is not decided by this lab. Specifically:
- Rolling rollout (200 RPS sustained, 25-second deterministic startup, three correctly-configured dedicated
/healthzprobes, 12 events over 2 hours): exactly 0 client-visible 5xx across 1,145,439 requests. - Explicit restart (same configuration, 3 events over ~33 minutes): exactly 1 client-visible 5xx across 289,932 requests (0.000345% overall, single-bucket max of 0.062% — well below the binding 0.5% threshold).
Both phases pass the binding falsification rule (≥3 consecutive buckets above 0.5%); the difference between "0 errors" and "1 error" is observed under this specific configuration, but is not large enough — under this lab's binding rule — to conclude that the rolling-rollout mechanism is causally responsible for the gap. Do NOT generalize either result to other configurations without re-running the lab.
The lab's design — pre-registered hypothesis, mechanical falsification rule, capped causal attribution — exists to keep this takeaway honest. A common operator failure mode is to interpret "no 5xx observed" as "no 5xx possible"; this lab's bucket-granularity measurement (10s, sum-across-50-VUs) and 15-event sample size (12 rolling + 3 restart) are designed to prevent that misreading. The Section 11 falsification statement is intentionally weak: 15 negative events do not prove a universal claim, but a single sustained 3-bucket window above 0.5% would have decisively refuted it.
The supplemental-phase forensic localization (Section 9: error fell ~18 seconds after a new replica's container start, inside the 25-second startup-delay window, while no old replica had yet been terminated) suggests that the platform's load balancer momentarily routed a request to a still-warming replica during the restart's first transition, OR a transient orchestration blip occurred. The two explanations are not distinguishable with this lab's instrumentation; the causal-attribution cap (Section 2 constraint #6) applies. The operational consequence is concrete: if your SLO requires strict zero errors during a restart, use rolling rollout instead; if your SLO tolerates ~10^-5 errors during the restart window, explicit revision restart is acceptable.
16. Support Takeaway
For support engineers handling tickets about "5xx during deploy":
- First check the falsification rule with the customer's traffic data. If their telemetry has 10s bucket granularity, ask for the bucketed err_pct around the rollout. If they only have minute granularity, the result is inconclusive — sub-minute transients are invisible at that resolution.
- Verify probe configuration first. The most common root cause is
/being used as both the workload and health path. Enumerate the three probes on the customer's app and confirm none of them is the heavy workload path; the historicalevidence/verify-001.logshows the exact live-Azure check pattern this lab originally used. - Distinguish rolling-rollout from explicit restart. If the customer used
az containerapp revision restart, supplemental-phase evidence applies. If they usedaz containerapp update --set-imageor--set-env-vars, perturbation-phase evidence applies. The two failure modes can look identical at the customer's edge but have different root causes. - The platform's masking depends on probe gating, not on rolling-rollout magic. If a customer's probes return 200 before the app is actually ready to serve traffic, the platform will route traffic to a not-yet-warm replica regardless of rollout strategy. Probe semantics is the load-bearing piece.
- Treat the verdict's evidence ceiling as binding. "Platform-initiated cause" of any 5xx during rollout is
[Strongly Suggested], not[Measured]. The smoking-gun evidence — Microsoft-internal traces of the load-balancer's exact routing decision during the transition — is not exposed through the management plane.
Clean Up
Preserve evidence before cleanup
./cleanup.sh deletes the resource group, which destroys the Log Analytics workspace and every ReplicaInventorySample, RevisionStateSample, and PerturbationWindowMarker row stored in it. Before running cleanup, complete all of the following:
- Export the required KQL queries (qA-qG from
verify.sh, plus any additional queries used in Section 12) from the Logs editor as CSV via the Export button. - Confirm the trigger and audit logs under
labs/startup-degraded-transient-failure/evidence/are committed (they back the falsification verdict and survive./cleanup.sh). - Capture every required Portal screenshot listed in Section 12 — they cannot be regenerated after the env is deleted.
| Command | Why it is used |
|---|---|
./cleanup.sh | Issues az group delete --yes --no-wait after an interactive confirmation. The 48-hour expires-at tag (from the Bicep template) is informational only — Azure may keep delete-pending resources for up to 24 hours after the delete call, but billing stops once the deletion completes. The Log Analytics workspace is destroyed too; already-ingested logs are retained per the workspace's 90-day retention policy only if the workspace survives, so export evidence to evidence/ first if you need it beyond deletion. |
See Also
- Startup-Degraded Bucketed 5xx KQL Pack
- Zone Redundancy Best-Effort Lab
- Revision management
- Health probes best practices
- Container Apps revisions overview