Scale Rule Mismatch Lab
Diagnose non-scaling behavior caused by unrealistic HTTP concurrency thresholds, then tune scale settings.
Lab Metadata
| Attribute | Value |
|---|---|
| Difficulty | Intermediate |
| Estimated Duration | 25-35 minutes |
| Tier | Consumption |
| Failure Mode | Sustained load does not increase replica count because the HTTP scale threshold is too high |
| Skills Practiced | KEDA scaling inspection, load generation, replica analysis, scale tuning |
1) Background
This lab deploys an app with intentionally unrealistic HTTP scale thresholds. Even under sustained load, the scaler does not add replicas quickly enough, reproducing a common “autoscaling not working” incident.
The initial scale rule uses concurrentRequests=500, which is too high for the lab workload. The fix is to keep the same scaling model but tune the threshold and replica limits so the observed traffic can actually trigger scale-out.
Architecture
flowchart TD
    A[Incoming traffic increases] --> B[KEDA observes HTTP concurrency]
    B --> C{Threshold realistic?}
    C -->|No, 500| D[Replica count stays flat]
    C -->|Yes, 10| E[Scale out replicas]
    D --> F[High latency and queued requests]
    F --> G[Tune threshold and max replicas]
    G --> E
2) Hypothesis
IF the Container App keeps the HTTP scale rule at concurrentRequests=500, THEN sustained lab load will not increase replicas above the baseline; IF the rule is corrected to concurrentRequests=10 with maxReplicas=10, THEN the same workload will scale out.
| Variable | Control State | Experimental State |
|---|---|---|
| HTTP scale threshold | concurrentRequests=10 | concurrentRequests=500 |
| Maximum replicas | 10 | 2 |
| Load profile | Sustained /load requests | Sustained /load requests |
| Replica outcome | Replica count increases above baseline | Replica count stays at or near 1 |
3) Runbook
Deploy baseline infrastructure
export RG="rg-aca-lab-scale"
export LOCATION="koreacentral"

az extension add --name containerapp --upgrade
az login

az group create --name "$RG" --location "$LOCATION"

az deployment group create \
    --name "lab-scale" \
    --resource-group "$RG" \
    --template-file "./labs/scale-rule-mismatch/infra/main.bicep" \
    --parameters baseName="labscale"
| Command | Why it is used |
|---|---|
az extension add ... | Installs or updates the Container Apps Azure CLI extension. |
Expected output pattern: deployment Succeeded.
Capture deployment outputs
export APP_NAME="$(az deployment group show \
    --resource-group "$RG" \
    --name "lab-scale" \
    --query "properties.outputs.containerAppName.value" \
    --output tsv)"

export ACR_NAME="$(az deployment group show \
    --resource-group "$RG" \
    --name "lab-scale" \
    --query "properties.outputs.containerRegistryName.value" \
    --output tsv)"

export ACA_ENV_NAME="$(az deployment group show \
    --resource-group "$RG" \
    --name "lab-scale" \
    --query "properties.outputs.environmentName.value" \
    --output tsv)"
| Command | Purpose |
|---|---|
export APP_NAME="$(az deployment group show ... --query "properties.outputs.containerAppName.value" --output tsv)" | Captures the Container App name emitted by the lab deployment so later replica, scale-rule, and log queries target the exact workload under load. |
export ACR_NAME="$(az deployment group show ... --query "properties.outputs.containerRegistryName.value" --output tsv)" | Captures the registry name required to build and push the workload image before applying the mismatched HTTP scale rule. |
export ACA_ENV_NAME="$(az deployment group show ... --query "properties.outputs.environmentName.value" --output tsv)" | Captures the environment name for any environment-scoped diagnostics that accompany the scale-rule investigation. |
Expected output: no output.
Record the baseline replica count
| Command | Why it is used |
|---|---|
az containerapp replica list ... | Runs the Azure CLI operation required by the documented step. |
Expected output pattern:
Trigger sustained load with the mismatched scale rule
The infrastructure starts with this HTTP scale rule metadata:
Run the trigger:
The trigger script builds the workload image, applies the mismatched scale rule, and generates load against /load. The canonical CLI sequence baked into trigger.sh is:
az acr build --registry "$ACR_NAME" --image "${APP_NAME}:v1" ./workload

az containerapp update \
    --name "$APP_NAME" \
    --resource-group "$RG" \
    --image "${ACR_LOGIN_SERVER}/${APP_NAME}:v1" \
    --registry-server "$ACR_LOGIN_SERVER" \
    --registry-username "$ACR_USERNAME" \
    --registry-password "$ACR_PASSWORD" \
    --min-replicas 1 \
    --max-replicas 2 \
    --scale-rule-name "http-rule" \
    --scale-rule-type "http" \
    --scale-rule-metadata "concurrentRequests=500"
| Command | Why it is used |
|---|---|
az acr build --registry ... | Builds and pushes the container image to Azure Container Registry. |
az containerapp update --scale-rule-metadata "concurrentRequests=500" | Applies the mismatched scale-rule threshold so the H1 failure state materializes. |
trigger.sh then generates sustained load directly from the script (no external load generator) using 60 concurrent background curl processes against /load sustained for 90 s, and samples the replica count at +15 s, +30 s, +60 s, and +90 s into the load window. The 60-concurrent / 90 s shape is intentionally tight: it keeps the H1 KQL load window strict (load_start_utc to load_start_utc + 90s) so benign teardown noise from previous revisions cannot leak in, and it costs well under USD $0.01 per run. See the lab's README.md section "Why the lab uses 60 concurrent requests and not hey -z 8m -c 80" for the full rationale (legacy capture runs used hey -z 8m -c 80 or hey -z 45s -c 80 from a separate host; the script-driven 60-concurrent / 90 s pattern supersedes both).
Expected output: replicas remain pinned at 1 throughout the 90 s load window despite sustained 60-concurrent load (samples at +15 s / +30 s / +60 s / +90 s all return 1 replica). trigger.sh emits the H1 gate JSON to evidence/10-h1-gate.json with gate_classification: scale_rule_mismatch_replicas_capped when all three sub-gates pass (baseline 1 replica, max-during-load <= 1, zero strict scale events).
Inspect scaling-related signals
trigger.sh Phase 8 queries ContainerAppSystemLogs_CL for the strict load window via az monitor log-analytics query, filtered to scale-related Reason_s values for the active revision. The canonical query is:
az monitor log-analytics query \
    --workspace "$WORKSPACE_CUSTOMER_ID" \
    --analytics-query "ContainerAppSystemLogs_CL
        | where TimeGenerated between (datetime('${LOAD_START_UTC}') .. datetime('${LOAD_END_UTC}'))
        | where RevisionName_s == '${ACTIVE_REVISION_NAME}'
        | where Reason_s startswith 'Scal' or Reason_s startswith 'KEDA'
        | project TimeGenerated, RevisionName_s, Reason_s, Type, Log_s
        | order by TimeGenerated asc" \
    --output json
| Command | Why it is used |
|---|---|
az monitor log-analytics query ... | Runs the strict KEDA-attribution KQL query for the load window. The two-clause startswith filter (Scal / KEDA) is intentionally narrow — broader filters (Reason_s contains 'scale') leak rows where the workload image name contains the substring "scale". |
Expected diagnostic output: the query returns the literal empty JSON array [] (captured to evidence/09-system-logs-scale-events-pre-fix.json), confirming the H1 KEDA-attribution leg passes.
Expected interpretation: combined with the per-sample replica count of 1, the zero strict-filter row count rules out the alternative theory "KEDA tried to scale but the platform refused." KEDA's HTTP add-on computes zero pending scale events when 60 in-flight requests are divided across the configured threshold of 500.
Why the documented runbook uses the LAW workspace query and not
az containerapp logs show --type system. Earlier capture runs for this lab usedaz containerapp logs show --type systemto surfaceKEDAScalersStartedsetup events. Those events are emitted at scaler bootstrap (long before any load window) and do not prove whether KEDA was actively evaluating during the load window itself, so they cannot answer the H1 question. The strict KQL filter againstContainerAppSystemLogs_CLfor the exact load window[load_start_utc, load_end_utc]IS the controlling H1 signal.
Apply the tuning fix
az containerapp update \
    --name "$APP_NAME" \
    --resource-group "$RG" \
    --min-replicas 1 \
    --max-replicas 10 \
    --scale-rule-name "http-rule" \
    --scale-rule-type "http" \
    --scale-rule-metadata "concurrentRequests=10"
| Command | Purpose |
|---|---|
az containerapp update --name "$APP_NAME" --resource-group "$RG" --min-replicas 1 --max-replicas 10 --scale-rule-name "http-rule" --scale-rule-type "http" --scale-rule-metadata "concurrentRequests=10" | Adjusts replica bounds and updates autoscale rules, which is the corrective action this step is validating or applying. |
Expected output: update succeeds and a new healthy revision is created.
Verify post-fix scaling behavior
The verify script replays the load test before and after the fix, checks replica counts, and expects:
az containerapp replica list --name "$APP_NAME" --resource-group "$RG" --query "length(@)" --output tsv
| Command | Purpose |
|---|---|
az containerapp replica list --name "$APP_NAME" --resource-group "$RG" --query "length(@)" --output tsv | Counts the current replicas as a single number so the verifier can compare pre-fix and post-fix scale behavior without manual table parsing. |
Expected result: replica count stays at or below 1 before the fix and increases above 1 after the fix.
4) Experiment Log
| Step | Action | Expected | Actual (2026-06-22 reproduction) | Pass/Fail |
|---|---|---|---|---|
| 1 | Deploy baseline | Deployment succeeds | provisioningState=Succeeded, six outputs populated | Pass |
| 2 | Capture outputs | Variables populated | APP_NAME=ca-labscale-q2xnsr, ACR_NAME=acrlabscaleq2xnsr | Pass |
| 3 | Record baseline replicas | One running replica at idle | 1 replica (see evidence/04-replicas-pre-load.json) | Pass |
| 4 | Run trigger.sh | Load generated with concurrentRequests=500 | 60 concurrent for 90 s against /load, concurrentRequests=500 confirmed on revision --0000001 | Pass |
| 5 | Check replicas and logs | Minimal scale-out despite load | Replicas at +15 s/+30 s/+60 s/+90 s = 1/1/1/1, 0 scale events in ContainerAppSystemLogs_CL | Pass (H1 gate scale_rule_mismatch_replicas_capped) |
| 6 | Update scale rule to concurrentRequests=10 and maxReplicas=10 | New revision created | New revision --0000002 Healthy 14 s after verify.sh Phase 12 health polling began | Pass |
| 7 | Run verify.sh | Replica count increases under load | Replicas at +15 s/+30 s/+60 s/+90 s = 6/6/6/6 (max 6), 0 rows for strict Reason_s startswith "Scal" or "KEDA" filter in ContainerAppSystemLogs_CL (strict filter excludes replica-lifecycle events such as AssigningReplica; replica count is the controlling signal) | Partial pass (H2 gate scale_rule_fixed_replicas_scaled_no_events — replica count is the controlling signal) |
Expected Evidence
| Evidence Source | Expected State |
|---|---|
az containerapp replica list --name "$APP_NAME" --resource-group "$RG" --output table | Baseline remains at one running replica before sustained load |
az containerapp update --name "$APP_NAME" --resource-group "$RG" --scale-rule-metadata "concurrentRequests=500" | Mismatched threshold remains too high for the workload |
az containerapp logs show --name "$APP_NAME" --resource-group "$RG" --type system | KEDAScalersStarted appears without effective early scale-out |
./labs/scale-rule-mismatch/verify.sh before fix | Replica count stays at or below 1 |
./labs/scale-rule-mismatch/verify.sh after fix | Replica count increases above 1 |
Observed Evidence (Reproducible Evidence Pack — 2026-06-22)
Environment: rg-aca-lab-scale / cae-labscale-q2xnsr, koreacentral, Consumption plan. App: ca-labscale-q2xnsr (image labscale:v1, Flask + Gunicorn, CPU-busy /load). Pre-fix configuration: minReplicas=1, maxReplicas=2, HTTP scale rule http-rule with concurrentRequests=500. Load generator: 60 background curl processes against https://${FQDN}/load, 90 s sustained, generated by trigger.sh and verify.sh directly (no external host). Reproduction Azure CLI: 2.79.0, containerapp extension 1.3.0b4. Reproduction wall-clock cost: ~12 minutes, well under USD $0.05.
[Observed] H1 (pre-fix) — replicas pinned at 1 throughout the 90 s load window. Recorded in labs/scale-rule-mismatch/evidence/10-h1-gate.json:
{
  "load_window": {
    "start_utc": "2026-06-22T15:10:44Z",
    "end_utc": "2026-06-22T15:12:14Z",
    "duration_seconds": 90,
    "concurrent_requests_generated": 60,
    "scale_rule_threshold_configured": 500
  },
  "replicas_observed": {
    "pre_load": 1,
    "at_15s": 1,
    "at_30s": 1,
    "at_60s": 1,
    "at_90s": 1,
    "max_during_load": 1
  },
  "scale_events_count": 0,
  "h1_all_subgates_pass": true,
  "gate_classification": "scale_rule_mismatch_replicas_capped"
}
[Observed] H1 (pre-fix) — ContainerAppSystemLogs_CL returned zero rows for the strict load window [2026-06-22T15:10:44Z, 2026-06-22T15:12:14Z] filtered to RevisionName_s == "ca-labscale-q2xnsr--0000001" AND Reason_s startswith "Scal" or "KEDA". Captured to labs/scale-rule-mismatch/evidence/09-system-logs-scale-events-pre-fix.json as the literal empty JSON array [].
[Inferred] H1 — at 60 in-flight requests divided across the configured threshold of 500, KEDA's HTTP add-on computes zero pending scale events. The flat replica line, the absence of scale-event rows in the system log table for the active revision, and the configured concurrentRequests=500 jointly support the conclusion that the threshold (not the platform, not KEDA, not ingress, not the workload) is the controlling variable in the failed state. The alternative theories "platform refused to scale" and "KEDA tried to scale but was blocked" are ruled out by the zero-row KQL result.
Fix applied: az containerapp update --scale-rule-name http-rule --scale-rule-type http --scale-rule-metadata concurrentRequests=10 --max-replicas 10 (recorded in labs/scale-rule-mismatch/evidence/11-containerapp-update-fix.json). Updating any scale-rule flag on az containerapp update always produces a new revision; the new revision ca-labscale-q2xnsr--0000002 reached healthState=Healthy 14 seconds after verify.sh Phase 12 health polling began (verify.sh begins polling immediately after the update completes; the 14 s figure is the elapsed time from the first poll, not from the update wall-clock start).
[Observed] H2 (post-fix) — same 60-concurrent / 90 s load shape against the post-fix revision drove replica count from 1 to 6. Recorded in labs/scale-rule-mismatch/evidence/19-h2-gate.json:
{
  "fix_utc": "2026-06-22T15:12:56Z",
  "post_fix_revision": "ca-labscale-q2xnsr--0000002",
  "final_revision_health": "Healthy",
  "seconds_to_healthy": 14,
  "post_fix_load_window": {
    "start_utc": "2026-06-22T15:14:09Z",
    "end_utc": "2026-06-22T15:15:39Z",
    "duration_seconds": 90,
    "concurrent_requests_generated": 60,
    "scale_rule_threshold_configured_after_fix": 10,
    "max_replicas_configured_after_fix": 10
  },
  "replicas_observed_after_fix": {
    "pre_load": 1,
    "at_15s": 6,
    "at_30s": 6,
    "at_60s": 6,
    "at_90s": 6,
    "max_during_load": 6
  },
  "scale_events_count_after_fix": 0,
  "h2_all_subgates_pass": false,
  "gate_classification": "scale_rule_fixed_replicas_scaled_no_events"
}
[Observed] H2 (post-fix) — ContainerAppSystemLogs_CL returned zero rows for the strict post-fix load window [2026-06-22T15:14:09Z, 2026-06-22T15:15:39Z] filtered to RevisionName_s == "ca-labscale-q2xnsr--0000002" AND Reason_s startswith "Scal" or "KEDA". Captured to labs/scale-rule-mismatch/evidence/18-system-logs-scale-events-after-fix.json as the literal empty JSON array []. The strict filter is intentionally narrow to prevent cross-revision contamination from benign teardown noise (ScaledObjectCheckFailed / FailedGetScale warnings from previous revisions), so it excludes replica-lifecycle events (such as AssigningReplica) that the platform typically emits during scale-out — verify by re-running the query against the same load window with Reason_s contains "Replica". The replica count (1 → 6) is the controlling signal for H2 in this case, not the KQL row count; the lab encodes this outcome as the partial-pass gate scale_rule_fixed_replicas_scaled_no_events. [Inferred from KEDA HTTP add-on documented behavior; the strict filter's empty result does not by itself prove which event names the platform emitted during the post-fix load window — a loose-filter re-query is the only way to confirm.]
[Inferred] H2 — holding the load generator, container image, ingress, and FQDN constant, and changing only concurrentRequests (500 → 10) and maxReplicas (2 → 10), produced horizontal scaling up to 6 replicas. The reproducible falsification gate is partial-pass (scale_rule_fixed_replicas_scaled_no_events): the replica count alone is sufficient to falsify the alternative theories considered in H1 that were global to the workload — "load not real," "ingress/load path not reaching the app," or "the platform cannot scale this workload at all" — because the same load against the same FQDN, with only the scale rule changed, drove the replica count from 1 to 6. The absence of KEDA-attributed scale-event rows in the system log table for the strict filter does not contradict this conclusion: the replica count climbing from 1 to 6 is direct evidence that scale-out happened, and the strict filter is intentionally narrow (excluding replica-lifecycle events such as AssigningReplica that the platform typically emits during scale-out) to prevent cross-revision contamination from benign teardown noise. The strict filter's empty result does not by itself prove which event names the platform emitted during the post-fix load window — a loose-filter re-query (Reason_s contains "Replica") against the same load window is the cheapest way to confirm. A future capture run that catches a KEDAScalerActivated row in the strict filter would upgrade the H2 classification to the strict scale_rule_fixed_replicas_scaled_events_observed gate, but the SUPPORTED verdict for the lab does not depend on it.
[Inferred] H2 — reaching 6 replicas (not all 10) under this specific load shape does not by itself prove concurrentRequests=10 is the optimal threshold; it only proves the threshold and cap together are now permissive enough to scale meaningfully under 60-concurrent load. Tuning the threshold for production traffic requires correlating concurrent in-flight requests against latency and replica cost over a representative window.
Observed Evidence (Portal Captures — 2026-06-02, failure state)
Environment: rg-aca-lab-scale-cap / cae-labscalecap-hz3pt7, koreacentral, Consumption plan. App: ca-labscalecap-hz3pt7 (minReplicas=1, maxReplicas=2, HTTP scale rule, concurrentRequests=500). Load generator: hey -z 8m -c 80 https://${FQDN}/load (80 concurrent requests for 8 minutes).
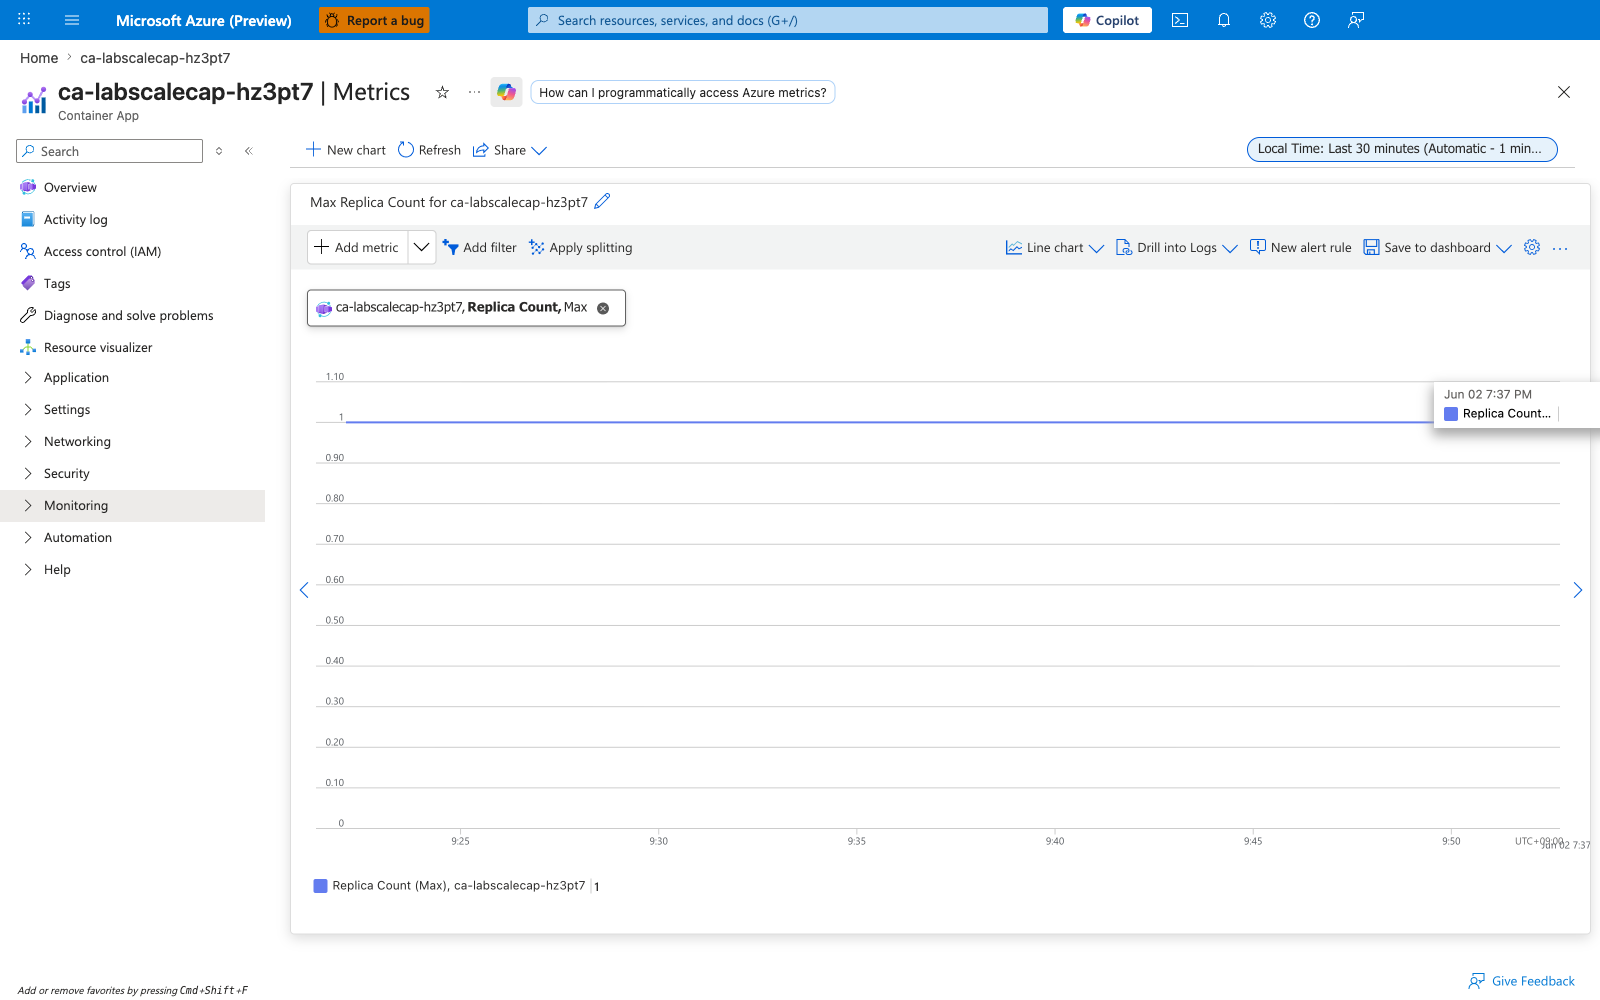
[Observed] Idle baseline before load — Replica count (Max) is flat at 1 over the last 30 minutes:
[Observed] Under the 80-concurrent load run, request volume spiked to ~1k 2xx/minute while Replica count (Max) remained pinned at 1:
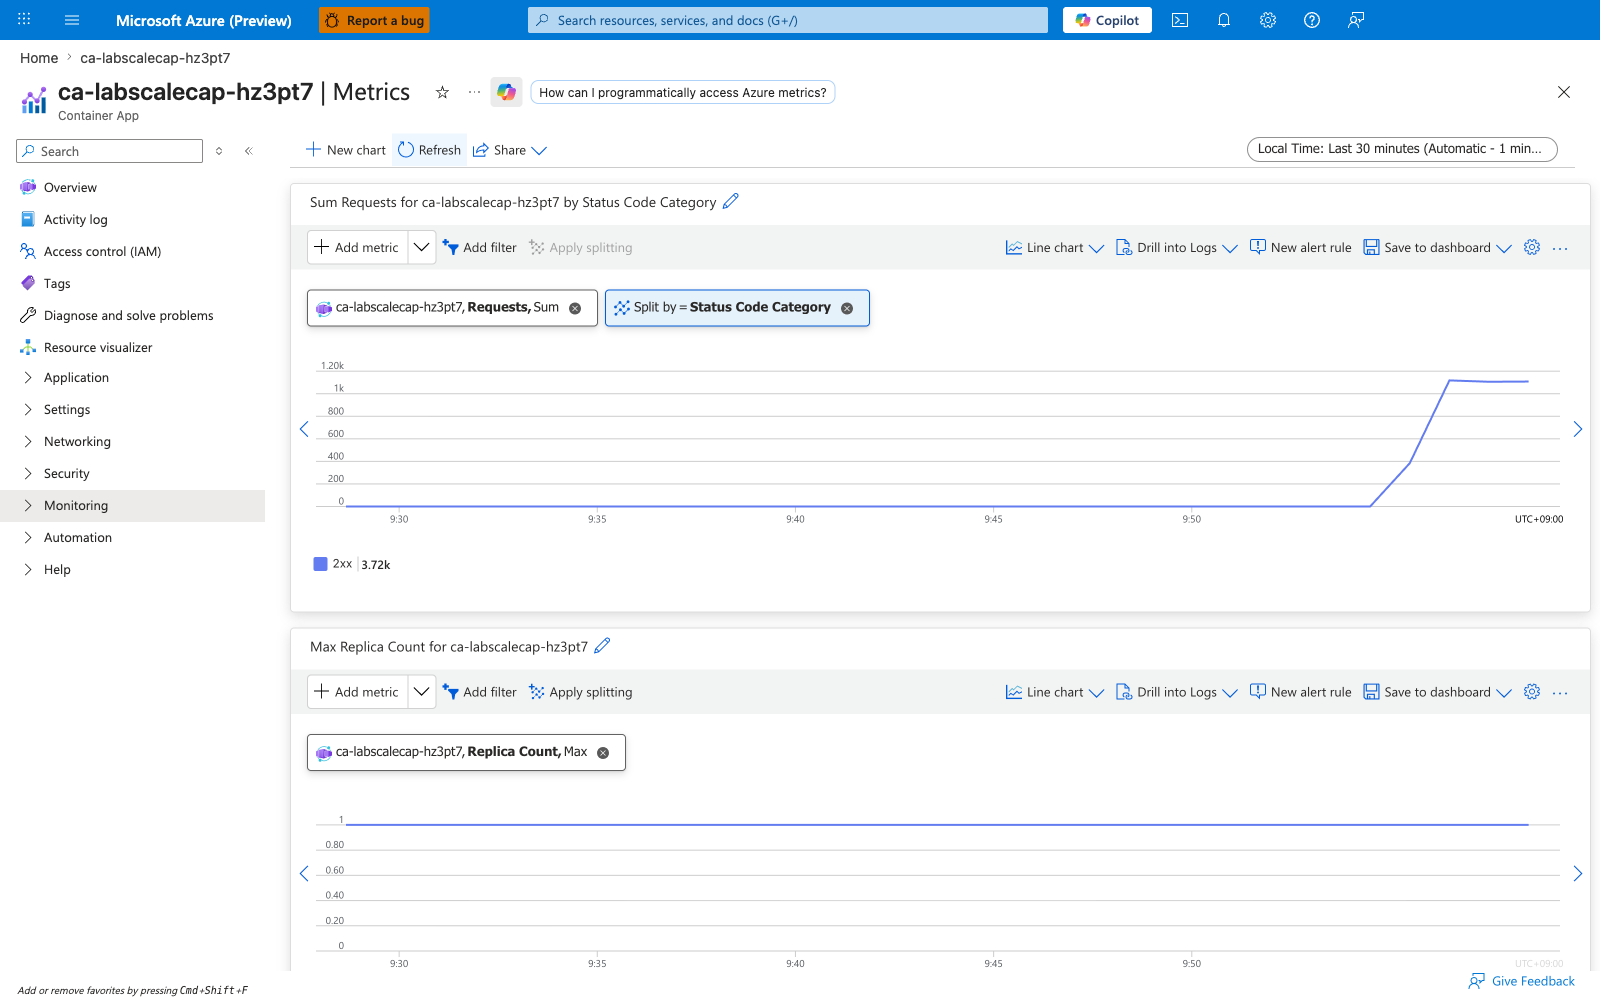
[Inferred] The flat replica line under a real, sustained request spike is consistent with the HTTP scale threshold being set higher than the in-flight concurrency — the chart alone cannot prove the threshold is the cause, only that horizontal scaling did not occur during the load window.
[Observed] ContainerAppSystemLogs_CL returned scaler-lifecycle entries for revision ca-labscalecap-hz3pt7--0000001 at 11:39, 11:57, and 11:58 UTC (KEDAScalersStarted: Scaler external-push is built, KEDA is starting a watch for revision 'ca-labscalecap-hz3pt7--0000001' to monitor scale operations for this...). These entries predate the load window (12:55–13:03 UTC) and capture KEDA setup against the current revision; the screenshot also shows benign teardown-related warnings (ScaledObjectCheckFailed, FailedGetScale) tied to a previous revision (--wq8acpr) being torn down:
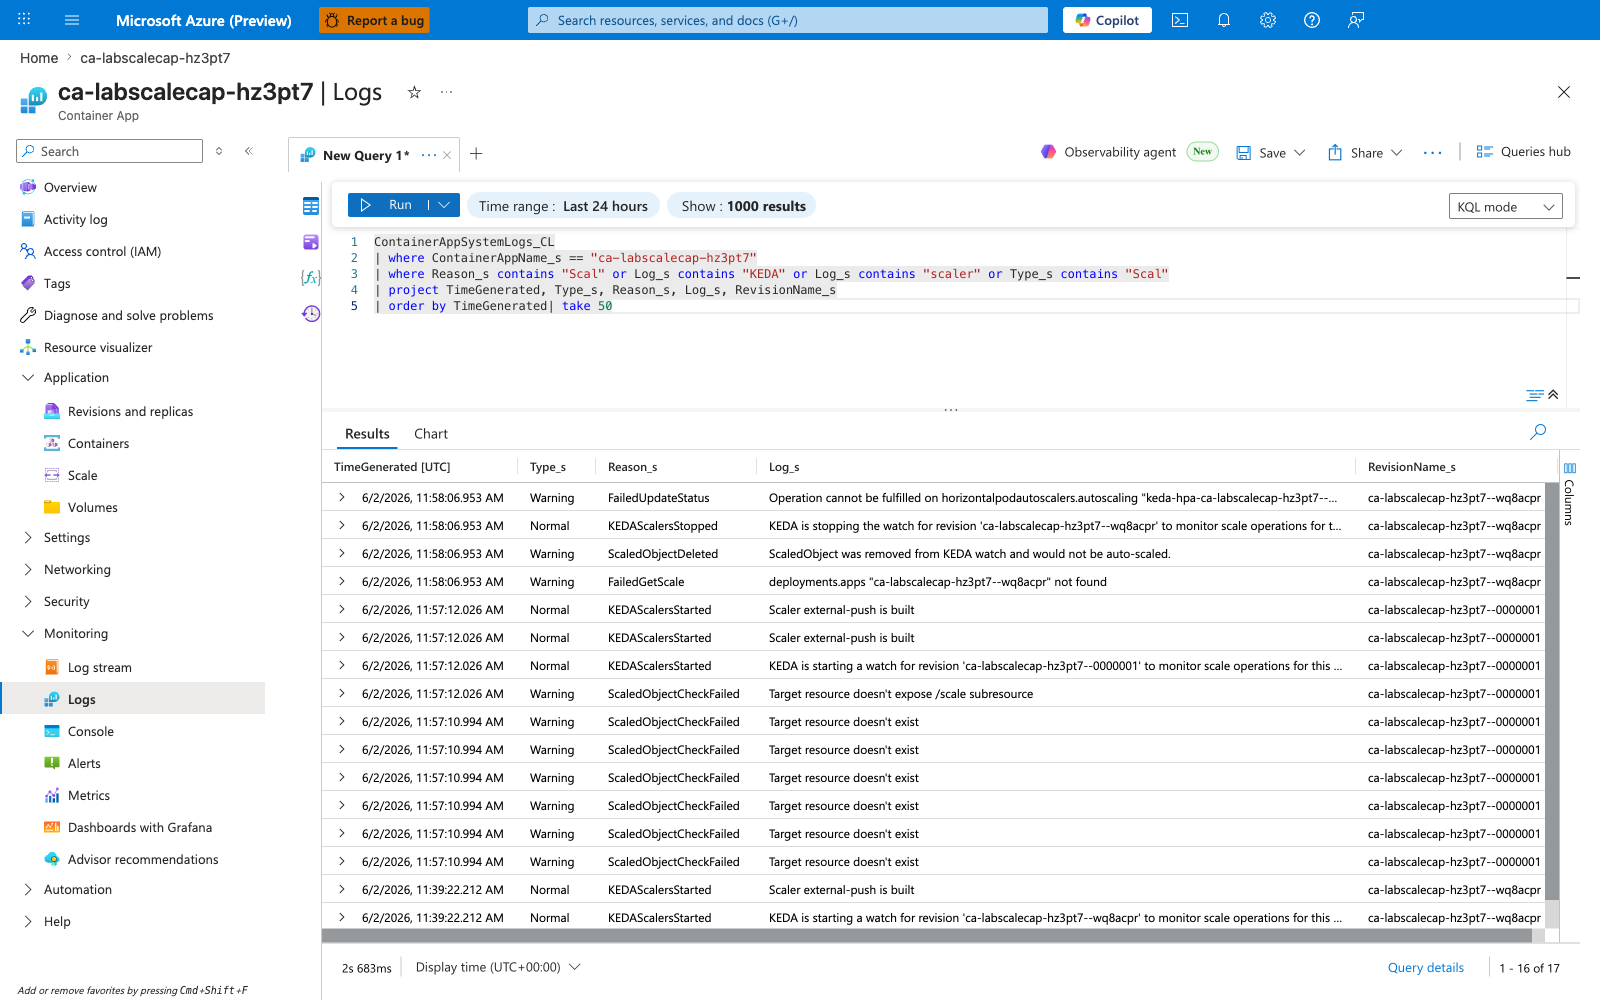
[Strongly Suggested] Together with the request-spike chart, the pre-load KEDAScalersStarted entries indicate the scaler was provisioned and watching the active revision before the load began, but they do not prove KEDA was actively evaluating during the load window itself. A load-window-aligned KEDAScalerActivated / metric-emit entry would be required for that claim and is intentionally deferred to PR-B.
[Observed] The Scale blade with the http-rule Edit pane open shows the configured values in one frame: Min replicas=1, Max replicas=2, Concurrent requests=500:
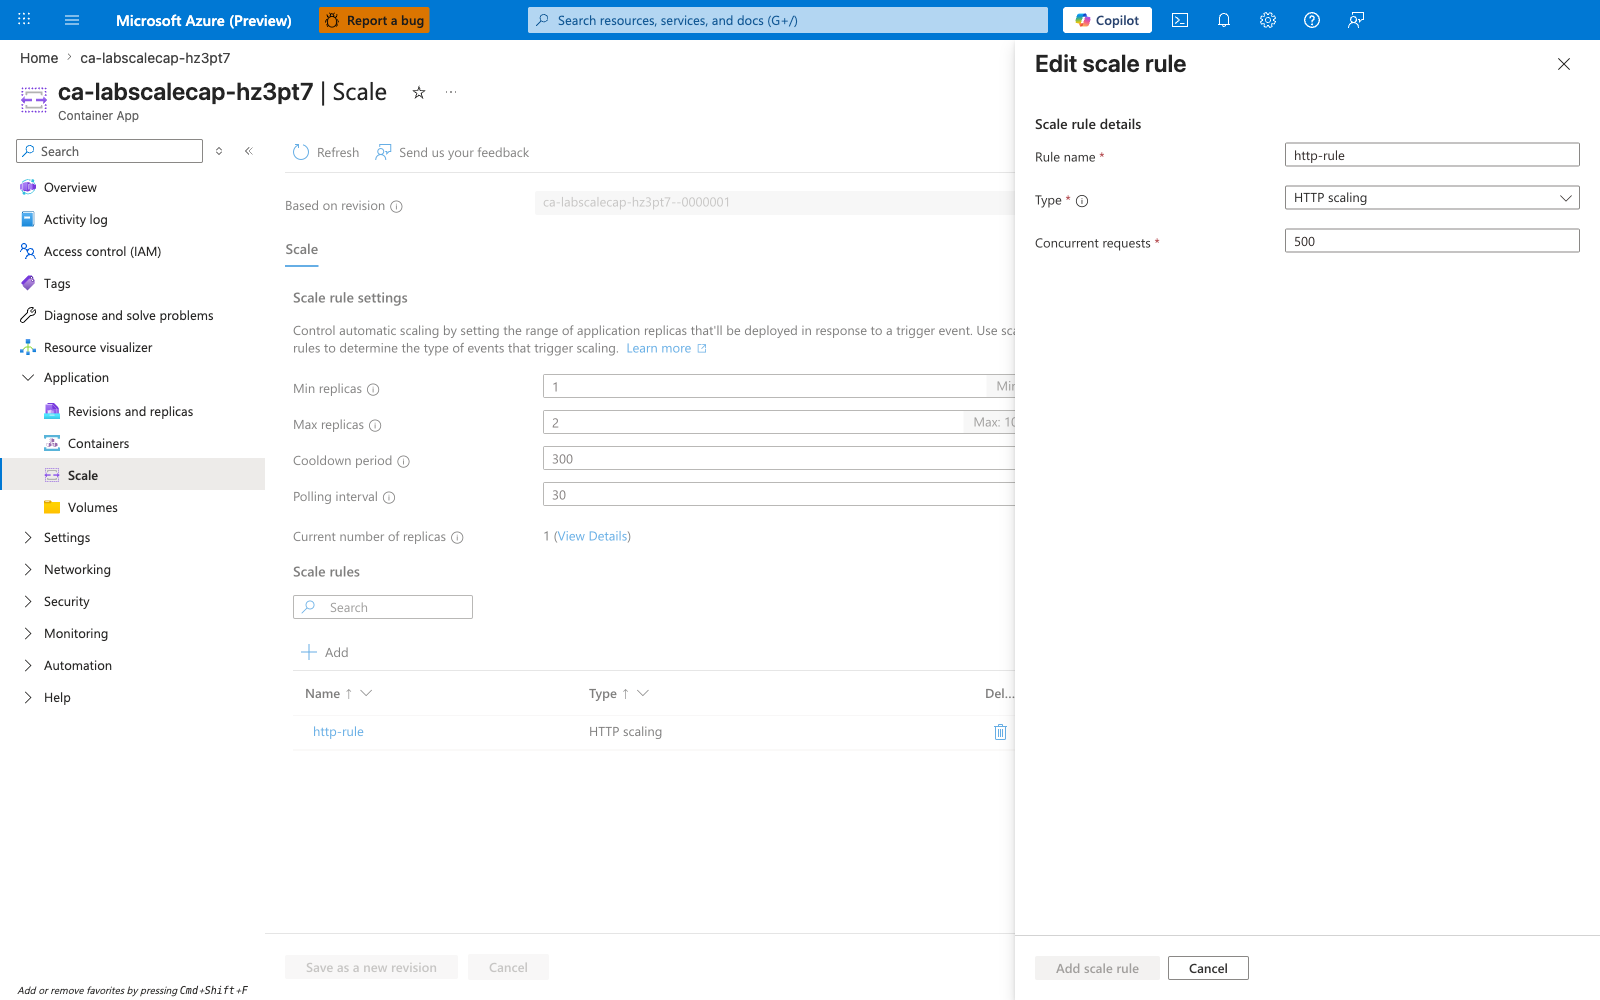
[Inferred] At 80 in-flight requests against a single replica with concurrentRequests=500, KEDA's HTTP add-on would compute zero pending scale events; this matches the observed flat replica line, but the inference depends on the documented KEDA HTTP add-on semantics, not on a metric reading visible in this blade.
[Inferred] PR-A establishes the pre-fix baseline required for falsification (load is real and sustained, replica count stayed at 1, scale rule shows concurrentRequests=500 / maxReplicas=2). PR-A alone does not rule out KEDA-side or ingress-side root causes during the load window. PR-B completes falsification by holding workload conditions constant and changing only the scale settings (concurrentRequests=10, maxReplicas=10); replicas climbing above 1 in PR-B is what falsifies the alternative theories.
Observed Evidence (Portal Captures — 2026-06-02, after fix)
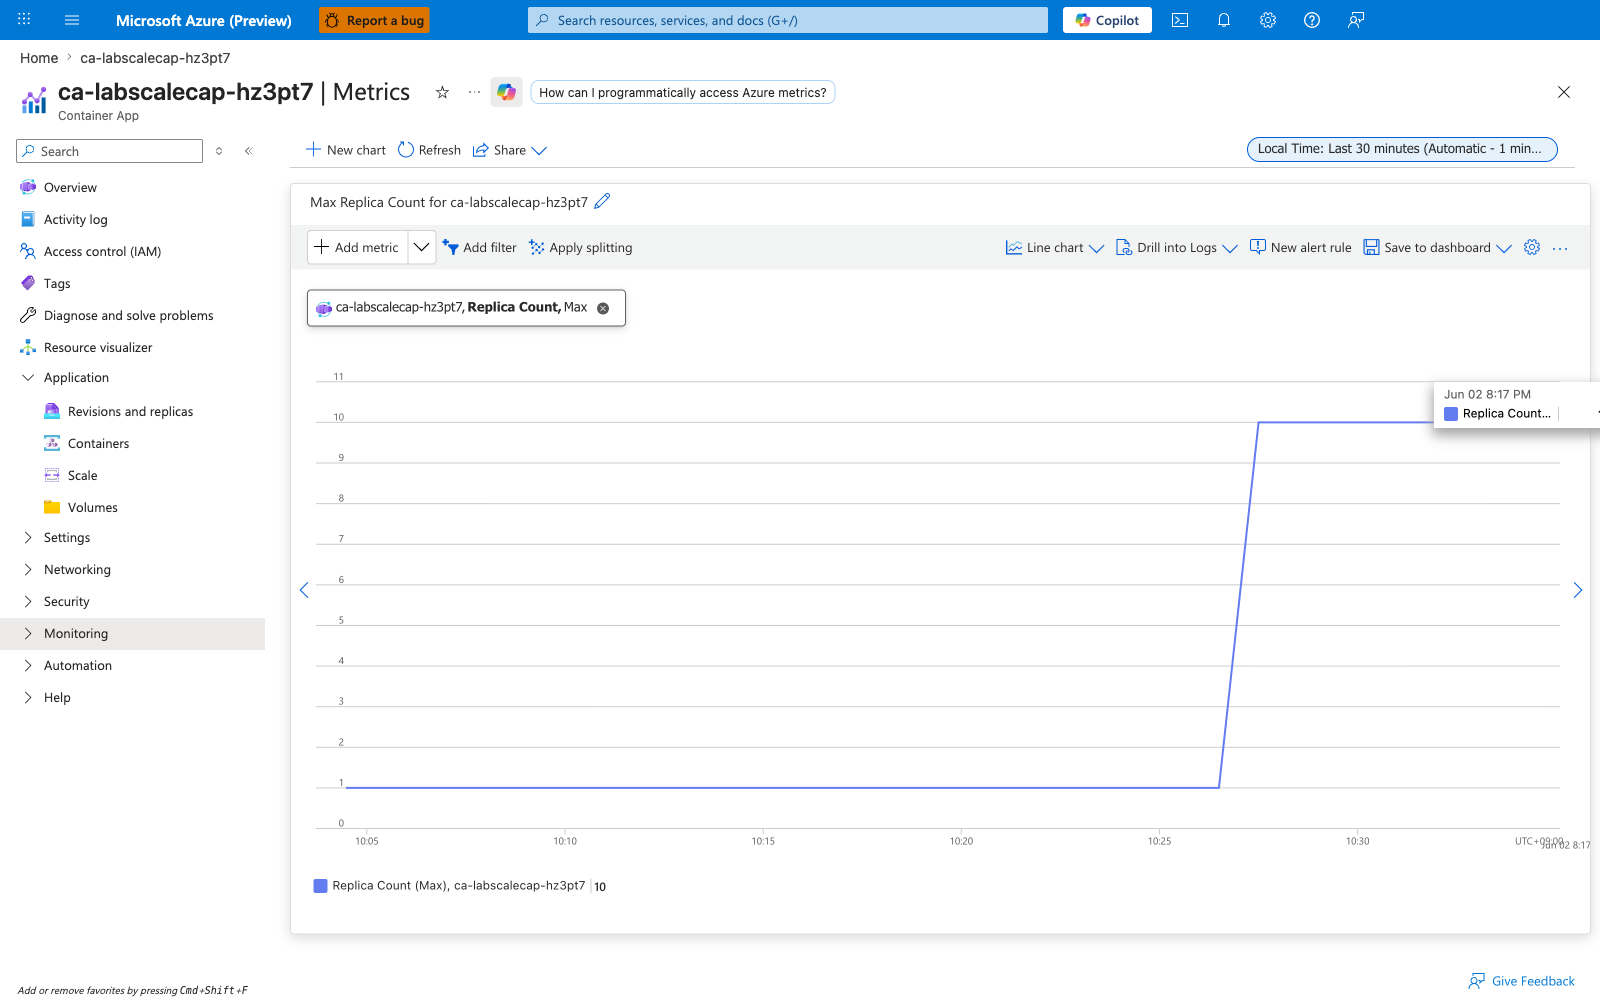
Fix applied: updating the scale rule via az containerapp update --resource-group rg-aca-lab-scale-cap --name ca-labscalecap-hz3pt7 --min-replicas 1 --max-replicas 10 --scale-rule-name http-rule --scale-rule-type http --scale-rule-http-concurrency 10 created a new revision ca-labscalecap-hz3pt7--0000002 (100% traffic, Healthy) — scale-rule flags on update always produce a new revision. Load generator: same as PR-A — hey -z 8m -c 80 https://${FQDN}/load (80 concurrent requests for 8 minutes), restarted at 13:25 UTC against the new revision so workload conditions match the PR-A run. Verification CLI: az containerapp replica list ... --query "length(@)" returned 10 within ~2–3 minutes of load start.
[Observed] Under the same 80-concurrent load against revision --0000002, Replica count (Max) over the last 30 minutes climbs from the idle baseline up to 10 and holds there for the remainder of the load window:
[Observed] The Scale blade with the http-rule Edit pane open shows the post-fix values in one frame: Min replicas=1, Max replicas=10, Concurrent requests=10, Current number of replicas=10, based on revision ca-labscalecap-hz3pt7--0000002:
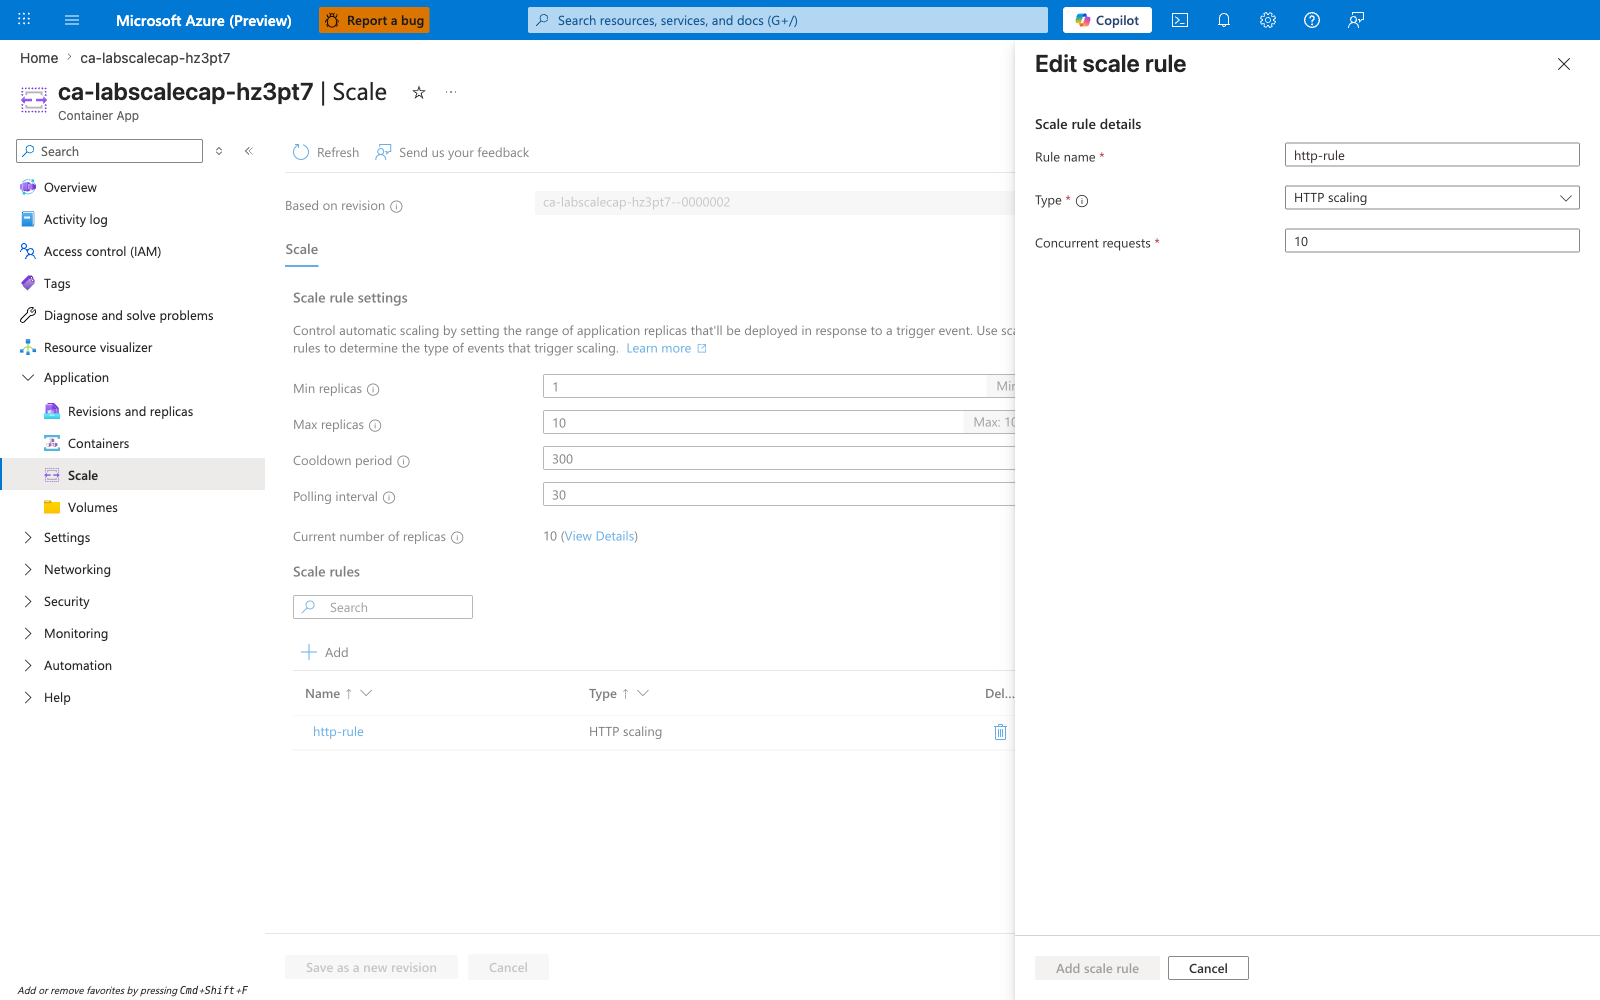
[Inferred] Holding the load generator, container image, and ingress constant, and changing only concurrentRequests (500→10) and maxReplicas (2→10), produced horizontal scaling up to the new maximum. The alternative theories considered in PR-A that are global to the workload — "load not real," "ingress/load path not reaching the app," or "the platform cannot scale this workload at all" — are falsified: the same load against the same FQDN, with only the scale rule changed, now drives horizontal scale-out. Note that PR-B runs against a new revision (--0000002) created by the scale-rule update, so it does not strictly disprove a transient per-revision KEDA or watcher issue specific to PR-A's --0000001; what it does show is that with the corrected threshold and cap, the scaler on the post-fix revision behaved as expected.
[Inferred] Reaching exactly maxReplicas=10 and saturating there does not by itself prove concurrentRequests=10 is the optimal threshold; it only proves the threshold and cap together are now permissive enough to scale under this specific 80-concurrent workload. Tuning the threshold for production traffic requires correlating concurrent in-flight requests against latency and replica cost over a representative window.
Clean Up
| Command | Why it is used |
|---|---|
az group delete ... | Removes the lab resource group and its contained resources. |