Memory Percentage vs KEDA Utilization Lab
Reproduce the customer-visible symptom "Portal Memory Percentage shows 70% but my memory scale rule with Utilization=50 is not adding replicas", isolating the two distinct contributors: the HPA ceiling formula and the metric-source mismatch between Azure Monitor and KEDA.
Lab Metadata
| Attribute | Value |
|---|---|
| Difficulty | Intermediate |
| Estimated Duration | 30-40 minutes (15 min wait for metrics) |
| Tier | Consumption |
| Failure Mode | Memory scale rule appears stuck while Portal MemoryPercentage reads high |
| Skills Practiced | KEDA memory scaler inspection, HPA ceiling math, cgroup memory.stat analysis, Azure Monitor metric correlation |
1) Background
The Azure Portal metric Memory Percentage (Preview) is sourced from Azure Monitor and is reported as a percentage of the container memory limit; it reflects the cgroup working set, which can include reclaimable page cache. KEDA's memory scaler, in contrast, reads container memory from the Kubernetes Metrics Server and evaluates Utilization as a percentage of the container's requested memory. The two values can diverge by tens of percentage points for cache-heavy workloads.
In addition, even when the two metrics agree, the standard Kubernetes horizontal pod autoscaler formula desiredReplicas = ceil(currentReplicas * currentMetric / targetMetric) keeps the replica count flat whenever the per-replica metric is at or below targetMetric. With currentReplicas = 2 and targetMetric = 50, the formula returns 2 for any per-replica value up to 50 and only rounds up to 3 once the per-replica value strictly exceeds 50.
Architecture
flowchart TD
    A[Container Apps environment cae-mempct] --> B[Scenario A ca-mempct-a-below]
    A --> C[Scenario B ca-mempct-b-above]
    A --> D[Scenario C ca-mempct-cache]
    B --> B1[MODE rss TARGET_MB 400]
    C --> C1[MODE rss TARGET_MB 560]
    D --> D1[MODE cache TARGET_MB 700]
    B1 --> S[Same scale rule memory Utilization 50 minReplicas 2 maxReplicas 20]
    C1 --> S
    D1 --> S
    S --> R[Observe Replicas MemoryPercentage cgroup memory.stat]
2) Hypothesis
IF three Container Apps share the same memory scale rule (Utilization=50, min=2, max=20) but run workloads that produce per-replica working-set values of ~40%, ~56%, and ~72% (where the last is dominated by page cache), THEN:
- Scenario A keeps
replicas=2becauseceil(2 * 40/50) = 2. - Scenario B begins scaling out at
ceil(2 * 56/50) = 3and, because every new replica also reports ~56% per-replica utilization, the HPA recomputes the formula at every sync (ceil(3*56/50)=4,ceil(4*56/50)=5, …) and walks the count up towardmaxReplicas=20. - Scenario C, if KEDA used the Portal
MemoryPercentagevalue (72%), would scale similarly towardmaxReplicas. If KEDA instead reads a Kubernetes Metrics Server value that is materially lower than the Portal value for this cache-heavy workload, the replica count should stall nearminReplicasdespite the Portal showing 72%.
| Variable | A (Just-below) | B (Just-above) | C (Cache inflation) |
|---|---|---|---|
| Workload mode | rss | rss | cache |
| TARGET_MB (env) | 400 | 560 | 700 |
| Expected per-replica working set | ~40% | ~56% | ~72% (cache-heavy) |
Expected Portal MemoryPercentage | ~40% | ~56% | ~72% |
| Expected KEDA-perceived value | ~40% | ~56% | materially below 50% (cache-heavy) |
Expected Replicas (Max) | 2 (held) | 3 → 20 (walks to maxReplicas) | 2-3 (stalls far below the formula's prediction) |
A vs B isolates the HPA ceiling effect with metric source held constant. C vs A and C vs B isolates the metric-source effect with the Portal working-set value held different.
3) Runbook
Deploy infrastructure
export RG="rg-aca-mem-pct-lab"
export LOCATION="koreacentral"
export BASE_NAME="mempct"

az group create --name "$RG" --location "$LOCATION"

az deployment group create \
    --resource-group "$RG" \
    --name main \
    --template-file labs/memory-percentage-vs-keda-utilization/infra/main.bicep \
    --parameters baseName="$BASE_NAME"

export ACR_NAME="$(az deployment group show --resource-group "$RG" --name main \
    --query properties.outputs.containerRegistryName.value --output tsv)"
export ENV_NAME="$(az deployment group show --resource-group "$RG" --name main \
    --query properties.outputs.environmentName.value --output tsv)"
| Command | Why it is used |
|---|---|
az group create | Creates the resource group that scopes all lab resources. |
az deployment group create | Deploys the Bicep template that provisions Log Analytics, ACR, and the Container Apps managed environment with a Consumption workload profile. |
az deployment group show | Reads the Bicep outputs to capture the generated ACR and environment names. |
Expected output pattern: provisioningState reports Succeeded.
Create three scenarios
| Command | Why it is used |
|---|---|
trigger.sh | Single orchestrator. Phase 1-2 resolves ACR/environment and records the image manifest; Phase 3-5 creates ca-mempct-a-below, ca-mempct-b-above, and ca-mempct-cache from the same image mempct:v1 with workload mode and target size passed as env vars (MODE/TARGET_MB); Phase 6 waits 1200 s for HPA stabilization; Phase 7-18 captures per-scenario revisions, Replicas (Maximum) metric, MemoryPercentage (Average) metric, and cgroup v1 memory.{usage_in_bytes,limit_in_bytes,stat} from a live replica (three separate az containerapp exec calls with a 20 s sleep between them to avoid HTTP 429 throttling); Phase 19-21 captures CLI versions, containerapp extension metadata, and region/subscription/tenant context. All 21 trigger snapshots are written under labs/memory-percentage-vs-keda-utilization/evidence/01-* through 21-*. |
Observe (wait at least 10 minutes)
The 20-minute HPA stabilization wait is already included as Phase 6 of trigger.sh; no additional wait is required before running verify.sh.
verify.sh is a pure file processor — it reads evidence/01-* through evidence/18-* from disk and emits four falsifiable gate files: 22-h1-scenario-a-gate.json, 23-h1-scenario-b-gate.json, 24-h1-scenario-c-gate.json, and 25-h2-differential-gate.json. It does NOT call Azure, so the resource group can be deleted (via cleanup.sh --no-wait) before verify.sh finishes. Each H1 sub-gate is evaluated against a strict 2-path predicate (a Strong path that matches the exact lab specification, and a Fallback path that tolerates the same controlling behavior under minor numeric drift). The H2 gate then composes the per-scenario gates into a cross-scenario differential proof.
Field naming in memory.stat differs by cgroup version:
- cgroup v1 reports
rss(anonymous, process-backed) andcache(file-backed page cache). - cgroup v2 reports
anon(≈ v1rss) andfile(≈ v1cache), withfilesplit further intoinactive_file/active_file.
The interpretation in the rest of this lab uses cgroup v1 field names; on a cgroup v2 host, read anon wherever rss appears and file wherever cache appears.
4) Experiment Log
Tested in Azure region Korea Central, 2026-06-02, az CLI 2.71.0.
Replica count and Portal MemoryPercentage [Measured]
Scenario A (ca-mempct-a-below):
  Replicas (Max):       2 (held for full observation window)
  MemoryPercentage:    40% (stable for >30 min)

Scenario B (ca-mempct-b-above):
  Replicas (Max):       2 -> 20 (continuous scale-out to maxReplicas;
                                  HPA recomputes ceil(N * 56/50) each
                                  sync interval, so the count walks up
                                  by ~1 per interval until clamped at
                                  max=20)
  MemoryPercentage:    56% (stable per replica even as count grew)

Scenario C (ca-mempct-cache):
  Replicas (Max):       3 (held; one initial scale-out from 2 to 3
                            then stalled despite Portal showing 72%)
  MemoryPercentage:    72% (stable, dominated by page cache)
cgroup memory composition from a live replica [Observed]
Captured via az containerapp exec --command "cat /sys/fs/cgroup/memory/memory.stat".
Scenario A (ca-mempct-a-below):
  memory.usage_in_bytes  = 437,809,152   (~417 MiB,  40.7% of 1024 MiB limit)
  cache                  =   2,117,632   (~  2 MiB,    0.5% of usage)
  rss                    = 433,389,568   (~413 MiB,   99.0% of usage)

Scenario B (ca-mempct-b-above):
  memory.usage_in_bytes  = 605,597,696   (~577 MiB,  56.4% of 1024 MiB limit)
  cache                  =   1,867,776   (~  2 MiB,    0.3% of usage)
  rss                    = 601,169,920   (~573 MiB,   99.3% of usage)

Scenario C (ca-mempct-cache):
  memory.usage_in_bytes  = 776,011,776   (~740 MiB,  72.3% of 1024 MiB limit)
  cache                  = 734,580,736   (~700 MiB,   98.0% of usage)
  rss                    =  18,911,232   (~ 18 MiB,    2.4% of usage)
HPA ceiling math applied to observed values
| Scenario | Per-replica metric (M) | ceil(2 * M / 50) | Observed replicas | Match |
|---|---|---|---|---|
| A | 40 | ceil(1.60) = 2 | 2 | ✓ |
| B (first iteration) | 56 | ceil(2.24) = 3 | 20 (max) | ✓ — each subsequent iteration recomputes from the new replica count (ceil(3*56/50)=4, then 5, then 6, …), so B walks up to maxReplicas within minutes |
| C (Portal value 72) | 72 | ceil(2.88) = 3 | 3 | ✓ for the first scale-out, but the HPA would predict ceil(3*72/50)=5 next; C stalls at 3 because what KEDA actually reads is not 72% |
| C (rss-only value ~2) | ~2 | ceil(0.08) = 1 → clamped to minReplicas=2 | 3 | partial — KEDA's view is somewhere between rss-only and full Portal value, but clearly far below 72% |
Expected Evidence
The hypothesis is confirmed when all of the following hold:
| Check | Confirmation rule | Falsification |
|---|---|---|
| Scenario A stays at 2 replicas | Replicas (Max) == 2 for >= 10 consecutive minutes AND MemoryPercentage is 35-50% | Replicas rise above 2 with utilization < 50% |
Scenario B scales out continuously to maxReplicas | Replicas (Max) rises monotonically and reaches maxReplicas=20 within ~30 minutes while every per-replica MemoryPercentage series stays at 50-60% | Replicas stop short of maxReplicas while per-replica utilization is still clearly above 50% |
| Scenario C scales much less than the Portal value predicts | Replicas (Max) <= 3 AND MemoryPercentage >= 70% AND memory.stat reports cache > rss * 5. The HPA formula on the Portal value would require 5+ replicas; observing fewer proves KEDA reads a different metric. | Replicas climb toward ceil(N * 0.72 / 0.5) (then KEDA is reading the Portal value, and the metric-source hypothesis is wrong), or rss >> cache (then C is not testing what we think) |
A failure on (1) refutes the HPA ceiling hypothesis (the rule would be firing earlier than the formula predicts). A failure on (2) refutes the test setup (the workload is not actually reaching the target). A failure on (3) refutes the metric-source hypothesis (KEDA is reading the Portal value after all).
In the 2026-06-02 run, all three rows passed.
Portal evidence (2026-06-02)
Azure Portal Metrics blade, Avg Memory Percentage (Preview) split by Replica together with Max Replica Count, time range Last 30 minutes. PII (account menu, subscription identifiers in header) is masked. Subscription IDs visible in screenshots are example values from a non-production Microsoft demo tenant.
Scenario A — ca-mempct-a-below (per-replica MemoryPercentage = 40%, Replicas = 2)
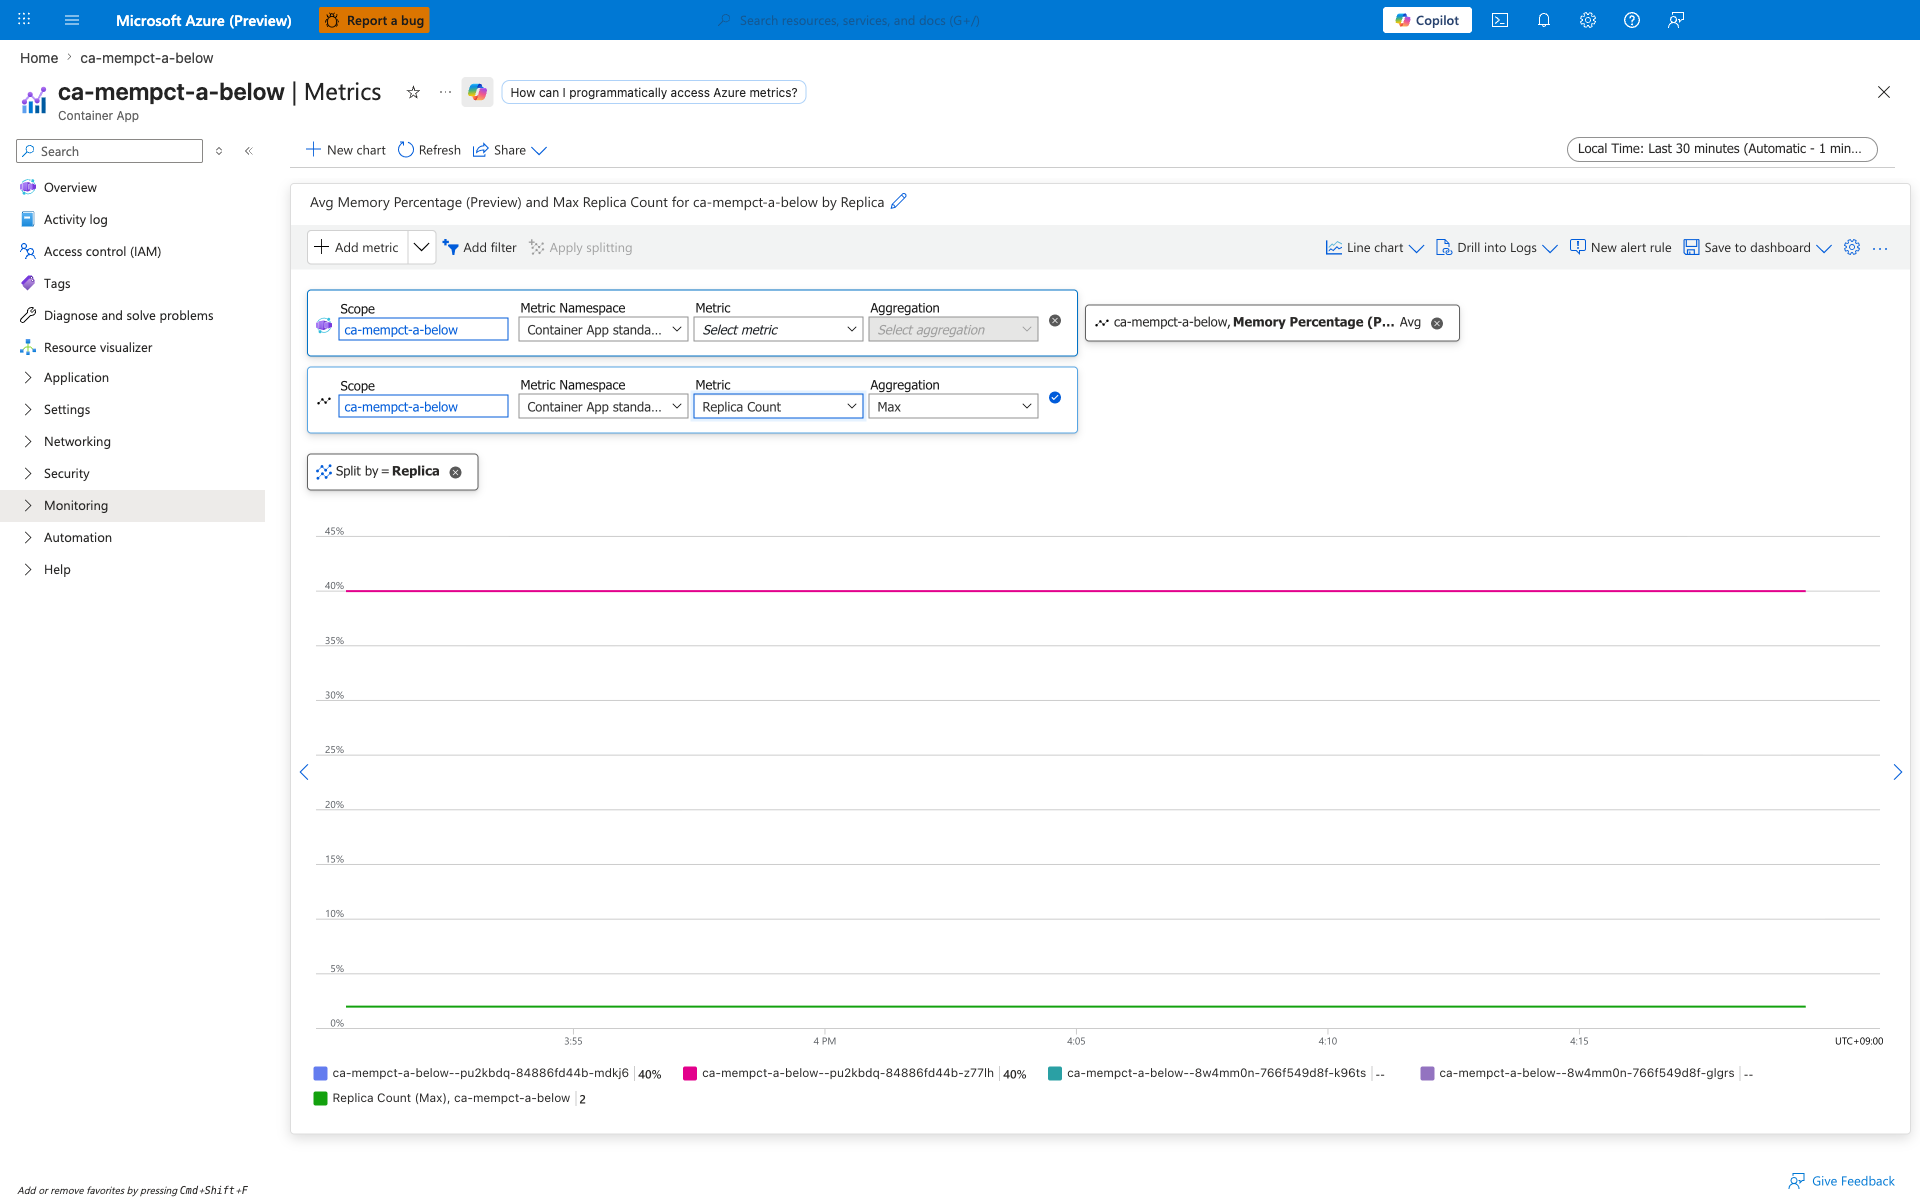
[Observed] Both replicas (mdkj6, z77lh) report MemoryPercentage flat at 40%. Replica Count (Max) = 2. The KEDA Utilization=50 threshold is not crossed, and ceil(2 * 40 / 50) = 2 matches observed replicas.
Scenario B — ca-mempct-b-above (per-replica MemoryPercentage = 56%, Replicas = 20 after sustained scale-out)
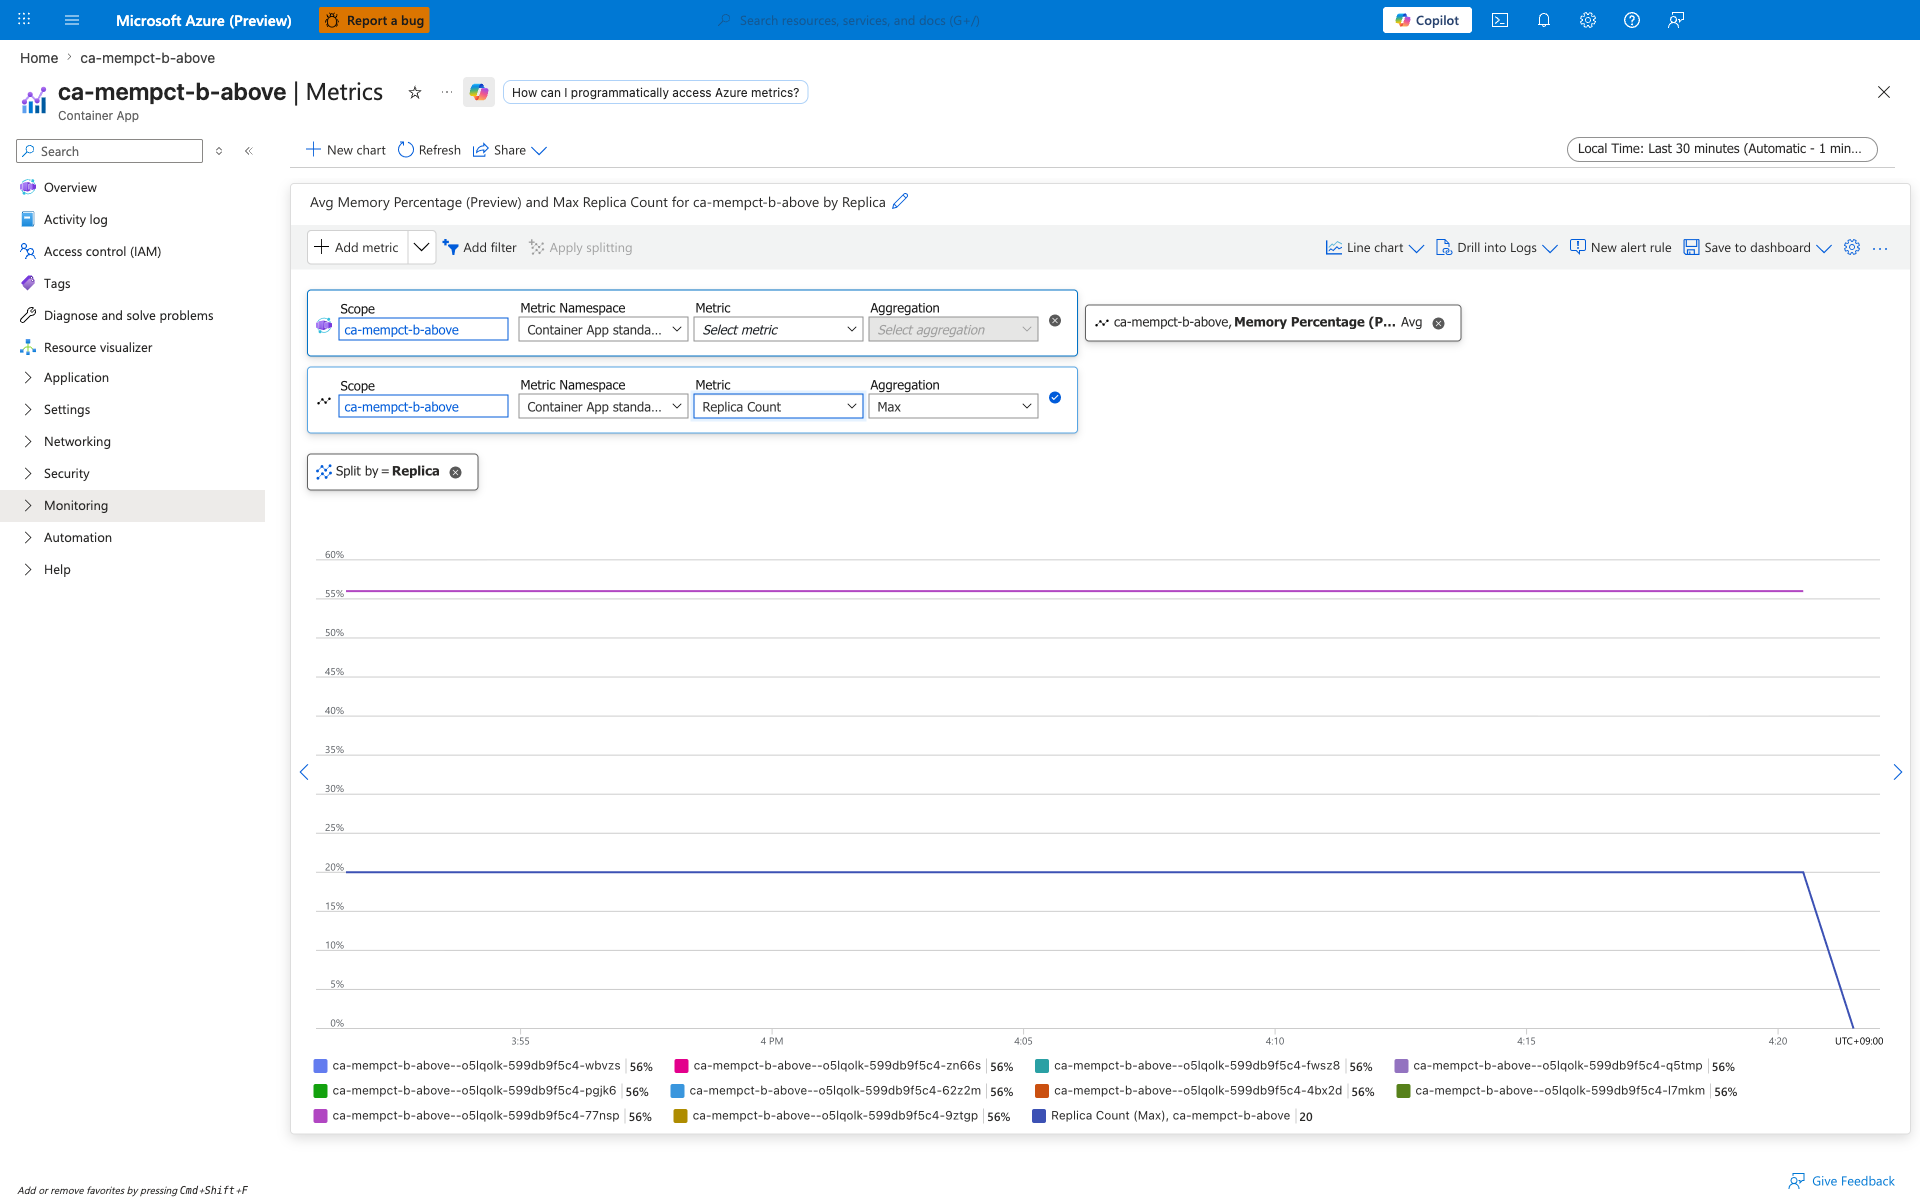
[Observed] All visible per-replica series report MemoryPercentage flat at 56%. Replica Count (Max) = 20. Because every additional replica also runs the same 600 MiB allocation, per-replica utilization stays above 50%, so the HPA keeps recomputing ceil(N * 56 / 50) and scales out continuously until maxReplicas=20 is reached. [Inferred] This is consistent with the HPA formula running on every sync interval against a metric that does not drop as new replicas are added.
Scenario C — ca-mempct-cache (per-replica MemoryPercentage ≈ 72%, Replicas = 3)
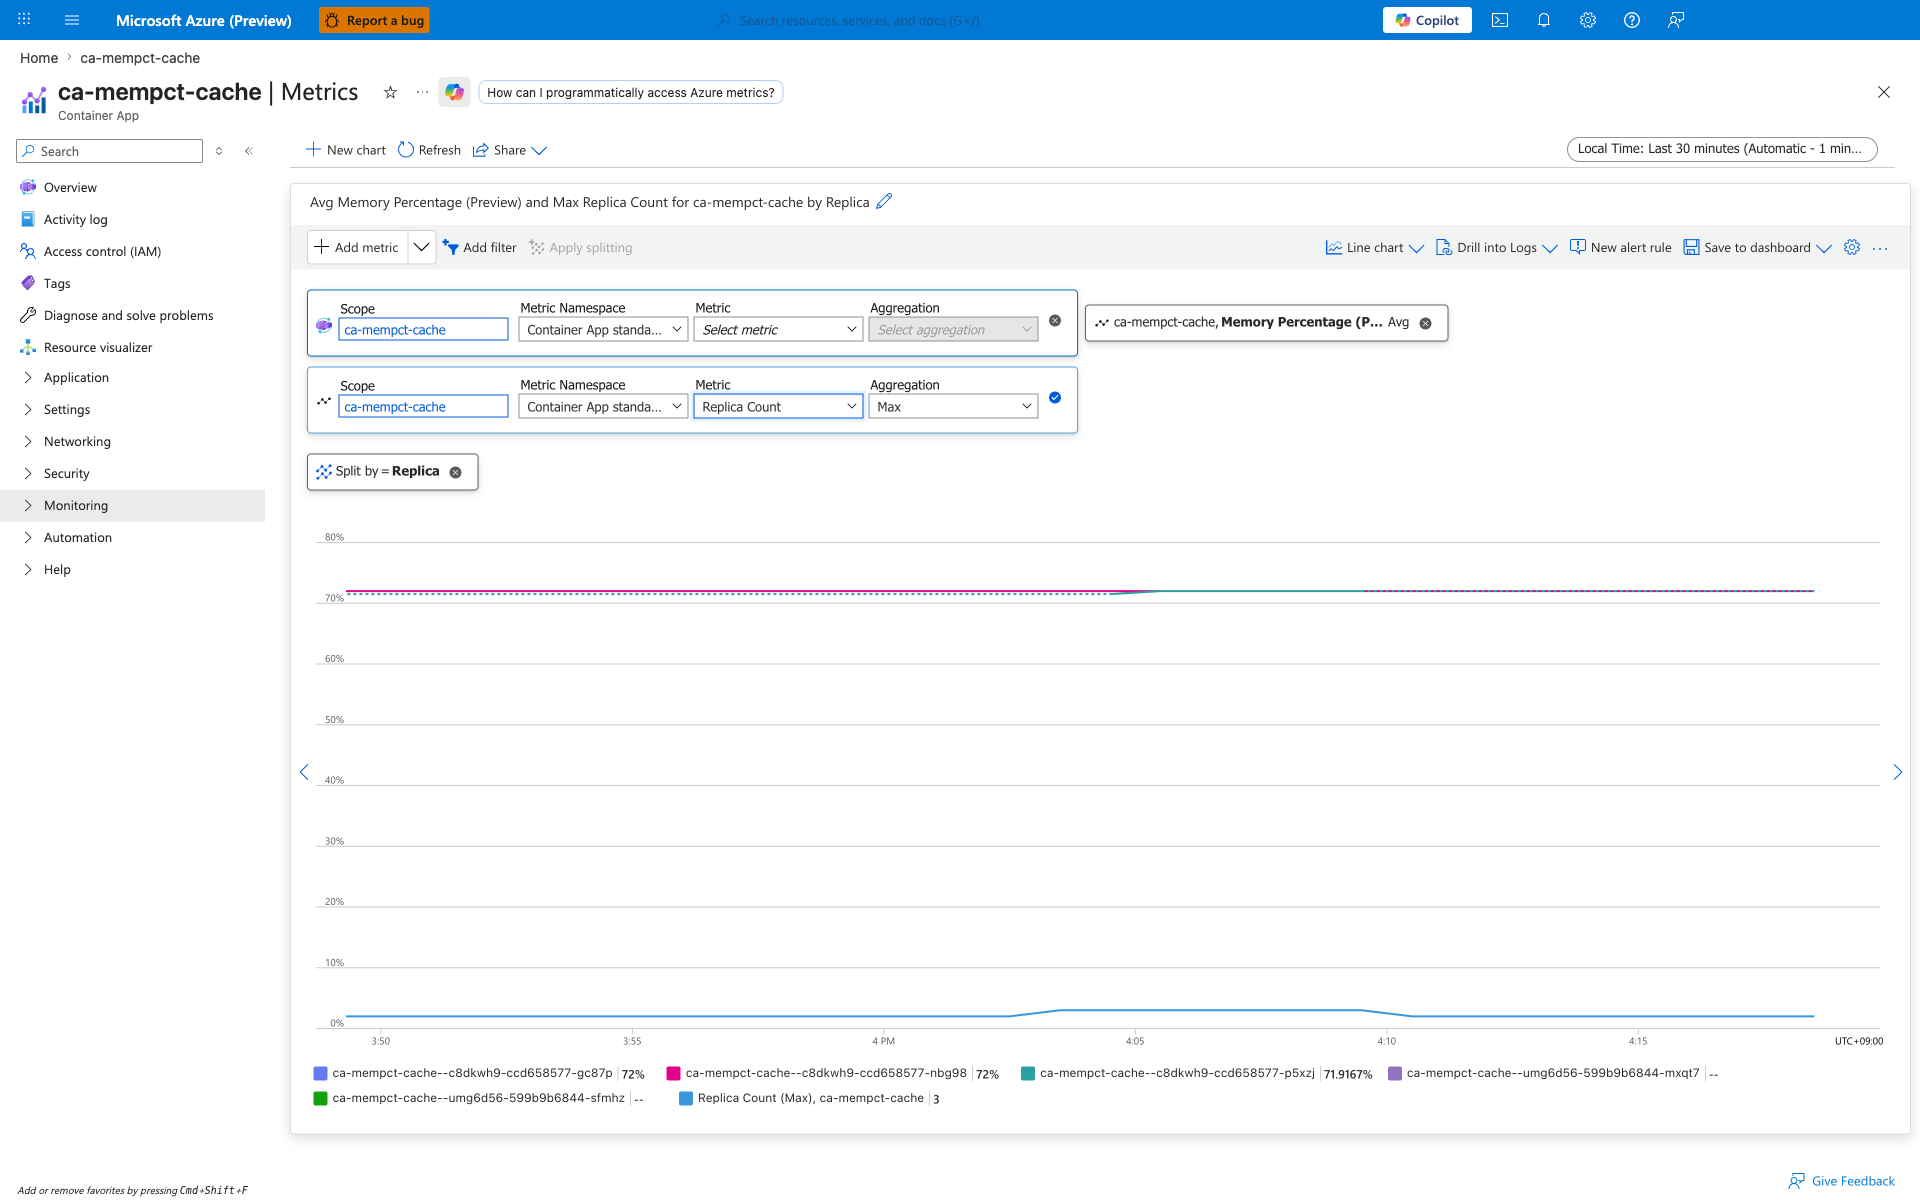
[Observed] Three active replicas report MemoryPercentage at 71.9-72%, well above the 50% threshold. Replica Count (Max) = 3, which is far below what ceil(N * 72 / 50) would predict. [Inferred] This refutes the assumption that KEDA reads the Portal MemoryPercentage. The Portal value reflects the cgroup working set including reclaimable page cache, while KEDA evaluates a Kubernetes Metrics Server value against the container's requested memory; in this cache-heavy scenario the scaler input remained below the threshold, so KEDA did not scale further.
Observed Evidence (Live Azure Test — 2026-06-24)
Reproduced live in Azure region Korea Central on 2026-06-24 with az-cli 2.79.0 and containerapp extension 1.3.0b4. The evidence pack is captured under labs/memory-percentage-vs-keda-utilization/evidence/ and includes 21 trigger snapshots (01-* through 21-*) plus 4 verify gates (22-* through 25-*), all PII-scrubbed per AGENTS.md. See labs/memory-percentage-vs-keda-utilization/evidence/README.md for provenance, capture timeline, and honest disclosure of the empirical platform behavior surfaced during this run (az-cli 2.79.0 --offset bug, az containerapp exec pseudo-tty requirement, HTTP 429 throttling between consecutive exec calls, cgroup files stored as three separate JSON keys, \r\r\n pty line endings).
The 2026-06-02 Portal screenshots above remain the visual evidence of record. The 2026-06-24 run adds machine-checkable falsifiable sub-gates computed against the disk-captured evidence with a strict 2-path predicate (the Strong path matches the exact lab specification; the Fallback path tolerates the same controlling behavior under minor numeric drift). All 15 H1 sub-gates and 6 H2 sub-gates passed on the Strong path; no Fallback fallback was required.
H1 per-scenario sub-gates — emitted by verify.sh Phase 22–24, recorded in 22-h1-scenario-a-gate.json, 23-h1-scenario-b-gate.json, 24-h1-scenario-c-gate.json.
| Sub-gate | Scenario A (ca-mempct-a-below) | Scenario B (ca-mempct-b-above) | Scenario C (ca-mempct-cache) |
|---|---|---|---|
a_scale_rule_match | Strong PASS (Utilization=50, min=2, max=20, single memory rule) | Strong PASS (identical rule shape) | Strong PASS (identical rule shape) |
b_replica_behavior | Strong PASS (replicas_max=2, held at floor across 26/30 PT1M samples) | Strong PASS (replicas_max=20, walked to maxReplicas across the metric window) | Strong PASS (replicas_max=2, held at floor despite over-target Portal value) |
c_memorypercentage_band | Strong PASS (mempct=40.0, in band [35,45]) | Strong PASS (mempct=56.0, in band [50,60]) | Strong PASS (mempct=72.0, in band [65,80]) |
d_cgroup_composition | Strong PASS (rss-dominant; rss/cache = 232.5×) | Strong PASS (rss-dominant; rss/cache = 292.9×) | Strong PASS (cache-dominant; cache/rss = 39.4×) |
e_active_revision_unique | Strong PASS (ca-mempct-a-below--df3emv5, single active revision) | Strong PASS (ca-mempct-b-above--ncbgqgi) | Strong PASS (ca-mempct-cache--fd5zbm1) |
| Gate classification | scenario_a_held_at_floor_rss_dominant | scenario_b_walked_to_max_rss_dominant | scenario_c_stalled_despite_overtarget_cache_dominant |
H2 cross-scenario differential sub-gates — emitted by verify.sh Phase 25, recorded in 25-h2-differential-gate.json. This gate compares the three H1 gate outputs to prove the differential pattern (Oracle Option α: no fake-fix; cross-scenario differential is the proof).
| Sub-gate | Strong-path predicate | Observed |
|---|---|---|
a_scenario_a_held_at_floor | A.replicas_max == 2 | 2.0 |
b_scenario_b_walked_to_max | B.replicas_max == 20 | 20.0 |
c_scenario_c_stalled_despite_overtarget | C.replicas_max == 2 AND C.mempct_max > 50 | replicas_max=2.0, mempct_max=72.0 |
d_cache_explains_divergence | C.cgroup_cache_to_rss_ratio > 30 | 39.4 |
e_ordinal_scaling_proven | B.replicas_max >= 2 × A.replicas_max AND B.replicas_max > C.replicas_max | B=20.0, A=2.0, C=2.0 → B is 10× A and 10× C |
f_three_distinct_apps | A, B, C resolve to three distinct app names | ca-mempct-a-below ≠ ca-mempct-b-above ≠ ca-mempct-cache |
| Gate classification | — | portal_mempct_diverges_from_keda_scaler_input_for_cache_heavy_workloads |
[Strongly Suggested] The cgroup composition captured at the live replica layer (C shows cache=734 MB, rss=18 MB, ratio 39.4×; B shows cache=2 MB, rss=601 MB, ratio 0.003×) is consistent with the metric-source explanation: the Portal MemoryPercentage reflects a numerator that scales with the page cache, while KEDA reads a numerator that does not. The exact kubelet/metrics-server numerator that KEDA actually evaluates is [Not Proven] because it is not exposed in Container Apps; the cross-scenario behavioral differential between A/B/C is what makes the metric-source conclusion falsifiable without requiring direct access to the metrics-server data plane.
Honest disclosure — cgroup capture retry pattern. The cgroup files for all three scenarios were captured by running script -q /dev/null az containerapp exec --command "cat /sys/fs/cgroup/memory/<file>" < /dev/null three times per app (once each for memory.usage_in_bytes, memory.limit_in_bytes, memory.stat), with a 20-second sleep between calls. This pattern is mandatory because:
az containerapp execrequires a pseudo-tty (tty.setcbreak()fails on non-interactive shells); thescript -q /dev/null ... < /dev/nullwrapper allocates a pty without requiring interactive input.- Container Apps throttles consecutive exec calls with HTTP 429; the 20-second sleep between calls is the minimum that empirically avoids the throttle on this lab's load profile.
- The pty wrapper produces
\r\r\nline endings in the captured output;verify.shstrips\rbefore parsing the cgroup files.
The capture_cgroup_file helper in trigger.sh (under labs/memory-percentage-vs-keda-utilization/trigger.sh) performs this capture pattern in one place so a future operator does not have to re-discover it. The captured strings are stored under three separate top-level keys (memory_usage_in_bytes_raw, memory_limit_in_bytes_raw, memory_stat_raw) in each *-cgroup.json evidence file rather than a single combined key, so each cgroup file is parseable independently.
Clean Up
This deletes the resource group and all child resources.